There was a batch of economic data out today that confirmed that the global economic expansion since the end of the Great Recession in mid-2009 was in trouble. The ‘recovery’ since then has already been the weakest since the 1930s.
Now data for the last quarter of 2015 from major capitalist economies showed that economic growth, as measured by real GDP growth, was slowing. In preliminary figures for the US economy, the most important and fastest growing of the major economies, in Q4 2015, real GDP rose only at a 0.7% annual rate, sharply down from the 2% pace recorded from Q3 2015. That meant the US economy had expanded in real terms (after inflation is deducted) by 2.4% in 2015, the same rate as in 2014. But the worrying sign was that in Q4 2015, the yoy rate was only 1.8%, virtually the same rate as the UK economy achieved in that last quarter.

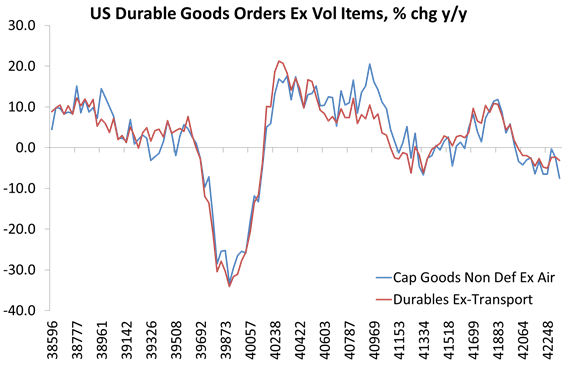
And the prospects for 2016 are probably worse. Earlier this week, figures for US durable goods orders, a measure of future investment purchases by America’s companies, showed a fall of 4.3% in December, making a 7.5% drop over the year.
Indeed, the real GDP figures released today showed that business investment contracted at a 1.8% annual pace, the first quarterly fall for over two years. In 2015, investment rose only 2.9%, the slowest rate since 2010. And it’s investment that drives a capitalist economy not consumption, as I have argued ad nauseam on this blog.

And earlier this week, we got the figures for the next fastest growing major capitalist economy, the UK. In the last quarter of 2015, UK real GDP grew at just a 0.5% rate (even slower than the US) and the slowest rate for three years. For 2015 as a whole, real GDP rose 2.2% down from 2.9% in 2014. Moreover, the economy was only larger by 1.9% in the last quarter – a sign that economic expansion was weakening. Most significant was that while UK real GDP has moved above its pre-crisis peak that is only because British population has risen, with the influx of migrants from mainly eastern Europe. Real GDP per head is virtually the same as it was in 2o08, eight years ago!

And the UK’s growth is led by an expansion in ‘services’. Manufacturing has been contracting. The main sector for growth has been in the financial and business services around the City of London. A new financial crash would soon put that in jeopardy
In the Eurozone, the situation remains worse than in the US and the UK. Spain has been recovering and recorded a 0.8% rise in the last quarter of 2015, led by ‘services’ and property. But the French economy is staggering along with just a 0.2% rise, thus achieving a growth rate of just 1.3% in 2015. The forecast at the beginning of 2015 was for 1.5%. The IMF forecasts 1.6% for this year. That must be in doubt. As for Germany, the forecast for the last quarter is for little or no growth.
And then there is Japan. Remember a few years ago, we were told that the new prime minister Abe had a plan to get the Japanese economy going through a mixture of monetary injections (quantitative easing), fiscal stimulus (government spending) and neo-liberal labour market reforms. Keynesian economists like Paul Krugman and Noel Smith were very keen on ‘Abenomics’ as confirmation of the efficacy of Keynesian policy, especially as it would include a depreciation of the yen’s value to boost exports and growth.
Well, today the Bank of Japan announced that it was going to introduce a ‘negative deposit rate’ for banks keeping cash with it. In effect, it would penalize Japanese banks for keeping excess cash with it. This is a desperate attempt to kick-start the economy and a major admission that current ‘Keynesian’ policies had dismally failed. Real GDP is crawling along and real household spending is falling, down 4.4% in December from a year ago while industrial production is contracting 1.4% yoy.

The BoJ acted just a day after one of the key architects of Abenomics. Akira Amari, was forced to resign as economy minister following allegations that he and his aides received bribes from a construction company.
The rest of Asia is slowing down too. We all know about China where growth has slowed to its slowest rate in a decade. But Taiwan also announced that its economy barely grew in 2015. Elsewhere, energy producer, Canada is in a ‘technical recession’, two quarters of contraction in real GDP and as reported before, the large so-called emerging economies of Brazil, Russia and South Africa are in deep slumps.
And another large emerging economy, tied closely to the US, Mexico also produced real GDP data that showed a slowdown in the last quarter of 2015 to 0.6% from 0.8% in Q3. Overall, Mexico grew 2.5% in real terms in 2015, slightly down from a weak 2.6% in 2014.
Is a new global recession impending? A bunch of mainstream and leftist Keynesian economists were asked their opinion by the UK’s Guardian newspaper. As far as I can read it, only one was forthright that a global recession was coming, although this was Albert Edwards who has been forecasting this for six years and even now when the recession was coming was not specified. The others hedged and fudged and were unable to get off the picket fence.
My position has been it is the job of economics to make forecasts just like any other science, even if that is much more difficult with social sciences where human decision-making is involved. But just like weather forecasting, your forecasts will be only as good as your theoretical foundations and empirical research. Based on Marx’s laws of motion under capitalism, profitability, debt and investment are key indicators of boom or slump. On those indicators, as I have argued in previous posts, a global recession is coming.
And as I argued at the beginning of this year, the timing of that has got much closer; maybe this year, but probably by the end of 2017 at the latest.

Couple of questions on your graphs:
On the US Durable Goods Orders % change y-o-y, what do the numbers on the x axis indicate? Certainly not years.
On the US private fixed investment as % GDP, how does, how can, non-residential private fixed investment EXCEED total private fixed investment?
sartesian yes they are a bit misleading. Durable goods graph should have months to date not numbers along the horizontal axis. The investment graph should have a key showing that the non-residential series (red) is measured from the right-hand axis to reach as numbered 12.8% compared to the full investment series (blue) at 16.3%. Will correct and make clear when I get a moment.
Cool. Thanks.
Reblogged this on Reconstruction communiste Comité Québec and commented:
Is a new global recession impending? A bunch of mainstream and leftist Keynesian economists were asked their opinion by the UK’s Guardian newspaper. As far as I can read it, only one was forthright that a global recession was coming, although this was Albert Edwards who has been forecasting this for six years and even now when the recession was coming was not specified. The others hedged and fudged and were unable to get off the picket fence.
My position has been it is the job of economics to make forecasts just like any other science, even if that is much more difficult with social sciences where human decision-making is involved. But just like weather forecasting, your forecasts will be only as good as your theoretical foundations and empirical research. Based on Marx’s laws of motion under capitalism, profitability, debt and investment are key indicators of boom or slump. On those indicators, as I have argued in previous posts, a global recession is coming.
And as I argued at the beginning of this year, the timing of that has got much closer; maybe this year, but probably by the end of 2017 at the latest.
Globally, the bosses won’t invest their capital because they cannot see an acceptable rate of profit. The rate of profit is the motive power of capitalist production. Commodities are produced only so long as they can be sold at an acceptable rate of profit. As capital’s own self-measure is profit, it is noted that, from the bosses’ point of view an economy is measured by how well or not profit is growing.
Marx scientifically reveals that it is capital itself that undermines the aim of capital, i.e. undermines the growth of the rate of profit.
The barrier that capital presents to its own activity, means, for example, that, globally, society sees more frequent and deeper recessions, and depressions in the growth of the bosses’ profits.
When the rate of profit falls to unacceptable levels the bosses will not invest their capital. The factories are there, the raw materials are there but because the bosses can’t realise acceptable growth in the rate of profit, from the use of labour power, workers are outside of the factory gates – lay-offs and redundancies and closures. That is, when the bosses can’t see an acceptable rate of profit, i.e. no growth, there is retrenchment.
The working class need the information that reveals the process that IS the exploitation of the worker. i.e., the information that shows the working class what exactly determines the relations of domination and servitude in capitalist society.
Karl Martel says
But just like weather forecasting, your forecasts will be only as good as your theoretical foundations and empirical research. Based on Marx’s laws of motion under capitalism, profitability, debt and investment are key indicators of boom or slump. On those indicators, as I have argued in previous posts, a global recession is coming.
From
jim drysdale:
Yes, Marx’s analysis of capital is scientific / dialectic. And, yes, the categories used by Marx do not map directly onto bourgeois economics. Certainly, data and statistics, that is, appearance only analysis, can validate the essence of change in capitalist society. Of course, the ruling class will, at the very least, fudge information that they offer. The thought of Marx continues to terrify the ruling capitalist class, precisely because it is scientific. More focus on change via contradiction please. e.g., Capital / labour, use value / exchange value. FOP / ROP. Need & use / versus profit. That is, take the ground away from beneath capitalist class propaganda, including their empirical data and statistics. Scientific analysis requires no forecasts.
About recession. Can you like predict when it might happen? Everything that is happening seem not right. I am not an economist or have any deep understanding of the economy. I just want to know it the recession is coming.
Reblogged this on Econo Marx 21.