At the beginning of January, I posted my economic forecast for the world economy in 2022. I argued that, although the major capitalist economies were likely to expand during 2022, real GDP, investment and income growth was likely to be much slower than the fast rebound in 2021 from the global pandemic slump of 2020. Last year had seen a leap back, as economies reopened after the first and second COVID waves of 2020. In the major economies, especially the US, that rebound had been helped by a significant injection of easy credit, zero interest rates and considerable fiscal spending. This rebound was akin to the ‘sugar rush’ that we get if we ingest a large dollop of sweet things to get ourselves going. There is a big boost, but it does not last.
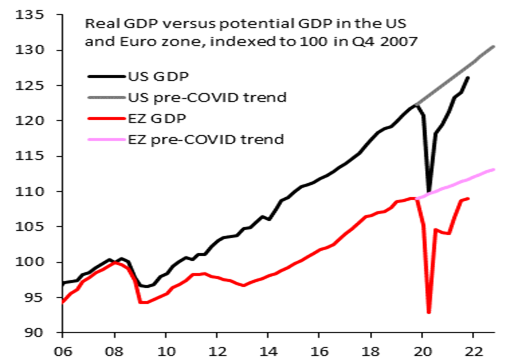
And that seems to be the case as we go into 2022. Much was made of US annualized 6.9% real GDP growth in Q4 2021, much higher than 2.3% in Q3 and well above forecasts of 5.5%. It was the strongest GDP growth in five quarters. But this headline figure hid some serious holes in the ‘growth story’. The biggest contribution to that 6.9% points came from inventory stocking (4.9% pts) – apparently car dealers restocking vehicles still to sell. Household spending contributed 2.2% points and business investment just 0.28% pts. Net exports (exports minus imports) contributed nothing; and government spending made a negative contribution of 0.5% pts (as taxes outstripped spending). Leaving out inventories, the US economy expanded by just 2% in Q4. Over the whole of 2021, the US economy jumped 5.7% after contracting 3.4% in 2020. US real GDP is now 3.1% higher than in pre-COVID 2019, but still 1.2% pts behind where GDP would have been if there had been no COVID slump.
Indeed, if you consult the new OECD weekly GDP tracker based on Google activity indexes, US real GDP was falling back going into January and the gap between current growth and the pre-COVID trend was widening, to -2.8% below pre-COVID trend growth. And it’s been slipping back since November 2021 under the pressure of the Omicron wave.

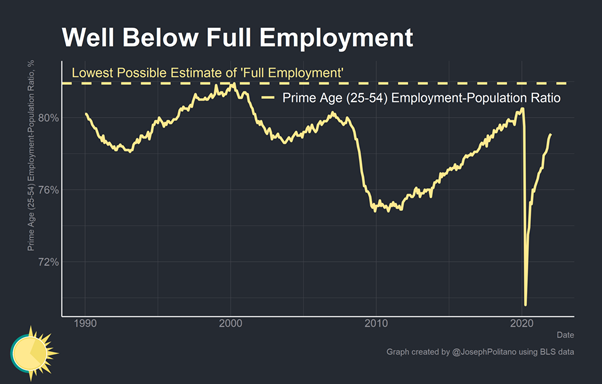
Last week, the US jobs market rose by 467,000 more employees according to official estimates– much more than expected and completely in contrast with a survey of private sector employment (called the ADP) which fell 301,000. Again, the cry was that the US economy was making great strides in recovering from the pandemic slump. But again, the headline figure hid some of truth. The reason for the sharp jump in the official figure was a revision of the census data which had been underestimating the number of Americans already at work in 2021. That was adjusted for by upping the November and December estimates. After accounting for this one-off census adjustment, jobs in January actually fell by 272k, while the household survey (another measure of jobs) showed a fall of 90k – the worst drop since the beginning of the pandemic. The reality is that only 80% of those Americans in the prime working age group (25-54 years) who had jobs before COVID have them now.
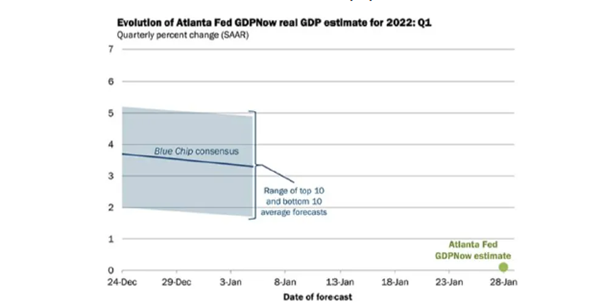
And consensus forecasts for US real GDP growth in this first quarter of 2022 have been drastically cut back. The Atlanta Fed GDPNow forecast currently stands at near zero for the current quarter (although that forecast will no doubt rise as more data come in) and the consensus forecast is just for 2.5%.
Leading investment bank Goldman Sachs reckons US economic growth will slow to just 0.5% yoy in Q1 2022. That’s down from its previous estimate of 2.2% and GS has also cut its forecast for the whole of 2022 from 3.8% to 3.2%.
It’s similar but worse story for the Eurozone. Eurozone real GDP rose 0.3% in Q4 2021. This was the slowest quarterly growth in 2021 as the Omicron wave hit. That meant Q4 2021 real GDP rose 4.6% compared to Q4 2020. For the year as a whole, real GDP rose 5.2% after a 6.4% contraction in 2020. This was the fastest expansion since 1977 but still slower than the US rise of 5.7%. But as in the case of the US, the rise in Q4 GDP was mostly from inventory stocking and not from sales, so the rate of growth will drop sharply in Q1 2022. Eurozone growth continues to lag the US. The US is closer to its pre-COVID GDP trend (which was already a weak 2.2% annual growth). The Euro zone is 2.5% below a much weaker 1.2% trend.
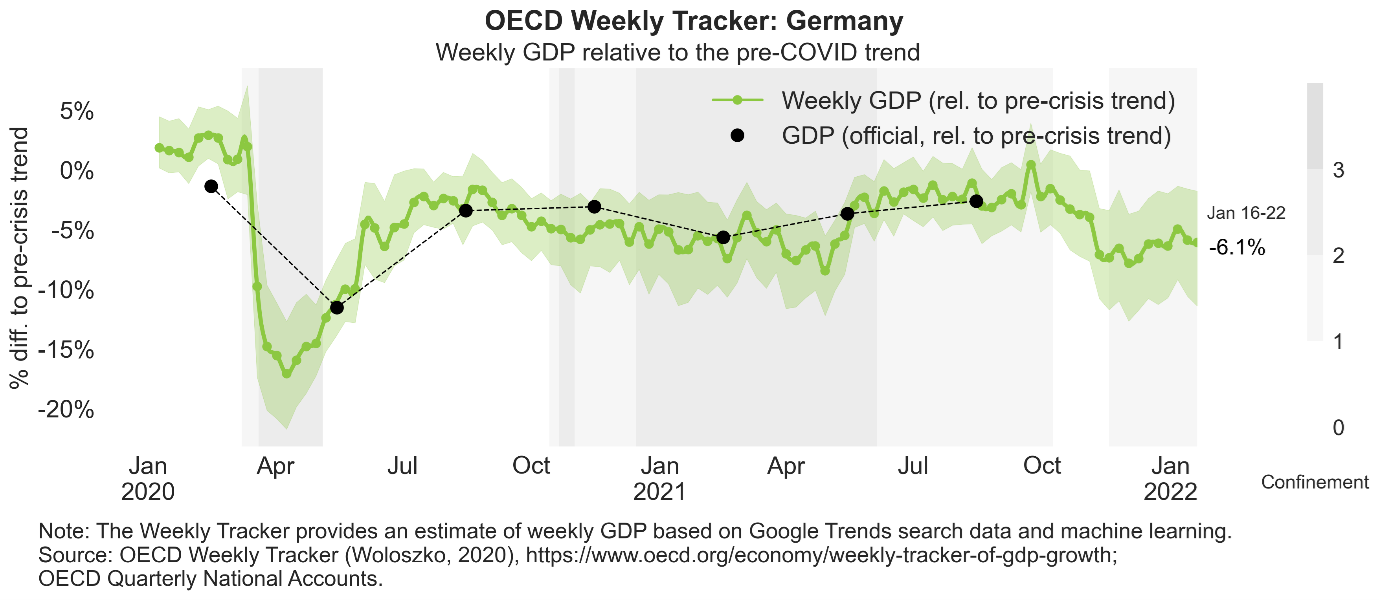
For example, Germany is some 6% pts below its pre-COVID trend according to the OECD.
So the prospects for the recovery in 2022 now look worse than the IMF forecast last October: the main culprits, the IMF argues, being the Omicron Covid-19 variant, supply shortages and unexpectedly high inflation. The global economy remains 2.5% points below its pre-COVID trend and the IMF now expects global growth to be about 4.4%, with US at just 4% (but note GS forecast above) and China at 4.8%. Given the current data, these forecasts look optimistic.
Why is the ‘sugar rush’ fading? It’s not just the impact of the Omicron wave. The main reasons I outlined in my January post. First, there had been a significant ‘scarring’ of the major economies from the COVID pandemic in jobs, investment and productivity of labour that can never be recovered. This was exhibited in a huge rise in debt, both public sector and private, that weighs down on the major economies like the permanent damage of ‘long COVID’ on millions of people.
This ‘scarring’ was also exhibited in a fall in average profitability of capital in the major economies in 2020 to a new low, the revival of which in 2021 was not sufficient to restore profitability even to the level of 2019. With average profitability in the major economies at lows, there is no incentive to increase investment sufficiently to boost supply. US productive investment, although recovered from the pandemic slump is still below the pre-COVID trend.

This raises an increased risk of a debt crisis in 2022 that will implode the bubble in financial assets, fuelled by cheap credit for the last two years. Such is the size of corporate debt and the large number of so-called ‘zombie companies’ that were not even making enough profit to cover the servicing of their debts (despite very low interest rates), a financial crash could ensue.
Already in January the huge stock market boom has ‘corrected’. In particular, the tech and media stocks that have driven the boom: Facebook, Alphabet, Microsoft and Netflix have taken a tumble along with the electric car phenomenon of Tesla.

And that other crazy bubble of the COVID period, cryptocurrencies, has also taken a hit.

The IMF has pointed out that the correlation between crypto and equity markets has been trending up strongly. “Crypto is now very closely tied to what is happening in equities. We can’t just dismiss it,” said IMF director of monetary and capital markets, Tobias Adrian. What this shows is that cryptocurrencies are not a new form of money but merely another speculative financial asset that will go up and down with stocks and bonds.

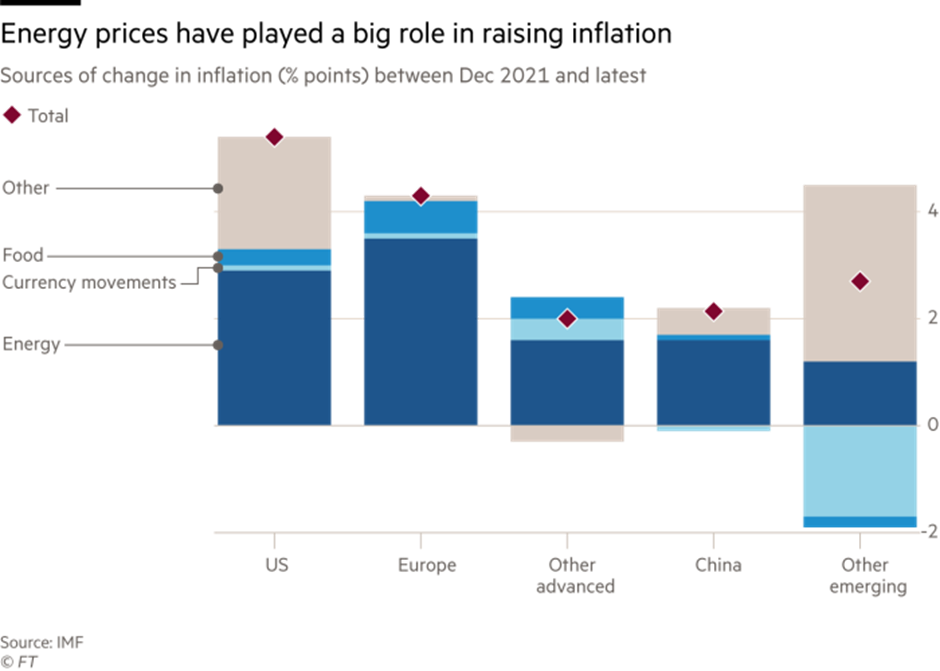
In my view, it’s the slowing down of the major economies and the continued supply bottlenecks in meeting consumer demand that has led to the huge spike in inflation rates.

That is revealed particularly in energy prices, the main driver of inflation.
And as I have discussed before, this puts central banks in a dilemma. Do they hike their policy interest rates to try and control inflation but risk a financial market crash and a recession; or do they hope that inflation rates will subside during this year and they can avoid provoking a crisis? The answer is that they do not know. But with inflation rates still rising, the leading central banks are grudgingly reversing their easy money policies of the last ten years. The Fed is ‘tapering off’ its bond purchases and preparing to hike interest rates several times this year. The Bank of England has already raised its policy rate twice while forecasting inflation to reach well over 7%. And even the ECB is talking about ‘tightening’ policy later this year.
The reality is that central banks have no real control over inflation anyway. But even so, they are trying. As a result, already market interest rates are rising. The US treasury bond, the benchmark floor for corporate borrowing, is on the rise with yields up 50bp.

This increases the risk of a corporate debt crisis with such a large section of companies in the major economies already in a ‘zombie’ state (ie not making sufficient profits to ‘service’ their existing debts).

As for the so-called emerging economies – they are already in a dire state. According to the IMF, about half of Low Income Economies (LIEs) are now in danger of debt default. Global debt has now reached $300trn, or 355% of world GDP. It is estimated that a 1% point rise interest rates increases global interest payments from $10trn a year to $16trn, or 15% of world GDP. And with a 2% pt rise, interest costs of $20trn or 20% of GDP. Then not only will several poor countries being forced to default, so will many weaker companies in the advanced economies – causing a ricochet effect through the corporate sector.
In the last 70 years, whenever the US inflation rate rose above 5% a year, a recession was necessary to get it down. And financial investors are taking note. That is revealed in what is called the ‘yield curve’ in government bonds, ie the gap between the interest rate on long-term bonds (10yr) and short-term ones (3m or 2yr). That ‘curve’ has been flattening.

Historically, whenever the curve completely flattens or even ‘inverts’ ie the interest rate on long-term bonds is lower than that on short-term bonds, a recession usually follows. The curve is flattening now because investors are expecting the Federal Reserve to hike interest rates sharply this year. If investors start to think that the economy is also slowing towards stagnation, they will then buy safe long-term bonds and the interest rate will fall on those. The yield curve will invert. It will be an indicator of a slump coming.

Hello Michael – is it too early to predict the effect of Long Covid on the economy in the UK for example? The UK ONS survey in Feb 2022 states: “Long COVID symptoms adversely affected the day-to-day activities of 836,000 people.” I guess his will probably massively rise as a result of the the scale of recent infections….
The picture is becoming clearer by the day. It’s all elegantly explained by the Theory of Value.
The USA started to print more and more money and, with the pandemic, also started to distribute beneficia to its people (the USD 1,300.00 checks and those loans to the petty bourgeoisie). This infusion of cash to the “little people” triggered a sudden spike in demand, which translated into a correspondent spike in imports of goods from China. This process only worked because the USA is the financial superpower, therefore it issues the universal fiat currency (the USD).
The rest of the capitalist world was then forced to sustain the USD Standard by accommodating those new dollars in circulation in their own countries. That means, in one way or the other, in some form of austerity (but not fiscal tightening, as that would make their currencies stronger against the USD): they had to consume less in order to make for the increased consumption of the US people. In this phase alone we can see the Monetary Theory is not scientifically true: the “real economy” completely unglued from the “monetary economy” around the world, except in the USA (that explains why MMT is still a thing there).
As a parenthesis, the USA bourgeoisie tried and continues to try to mitigate such financial ballooning in relation to the “real economy” in the political realm: they’re trying to cut off Europe from Russian gas in order to sell its LNG there; they’re trying to transfer Taiwan’s semiconductor industry and know-how to the USA mainland (Arizona); they’re forcing its richer allies (e.g. Japan, Norway, Israel) to buy the defective F-35 in large quantities; they’re making a desperate multi-millionaire expansion of the Californian port etc. The American capitalist class knows it will eventually have to “correct the market” with some real returns on the “real economy” sphere (i.e. trade balance).
The Third World countries, as always, were completely drained and are suffering the most. But that was always the case and there’s a problem: they have little. There’s only so much you can fleece the poor. The novelty now is that the USA needs so much capital that it is now starting to devour its First World allies also. Even that does not seem to be enough, and inflation continues to rise (it has to rise because the American capitalist class has to cancel out the effect of the pandemic checks to its working class, thus restoring the American social profit rate).
Note how China is not cyclically affected by this process. Yes, it will slow down in 2022 because it is not isolated from the rest of the world as the USSR was, but it is not susceptible to the cycles of the USA economy. Its inflation was completely under control in 2021, and it is the only economy in the world to have fully recovered (i.e. V-shaped) from the pandemic. Only the existence of socialism in China can explain that.
China is now the main problem for capitalism. The capitalists need to completely destroy China, in order to end all hope for a positive exist to this depression. They need to make T.I.N.A. a self-fulfilling prophecy. With socialist China destroyed, capitalism will not need to worry about inequality for centuries to come, as the wave of revolutions that started in 1917 ended in 1989.
In purely economic terms, my expectation is that the USA will continue to tendentiously decline – and, by “USA”, I mean the entire capitalist world (the Capitalist Empire, also known as “Western Civilization”, “the West”, “Free World”, “Democracy”, “Rules-Based World Order”).
Your last paragraph contradicts the penultimate one. Whatever NATO’s or Davos’ degenerating pinheads think or do, the rate of profit will continue its tendentious fall and capitalism will face revolutionary change in the years (not “cemturies”) to come. Apparently, you had a nightmare and then woke up.
”Capitalism will face revolutionary changes in the years (not “centuries”) to come.”
True, and to be more precise, it is highly probable (not to use an expression with absolute determinism) that such a revolution will take place around the year 2040, as predicted by the thesis of the revolutionary cycle (class struggle). Revolutions follow very determined cycles and do not arise as randomly or as far apart in time as commenter VK suggests. And a very candidate country for that next revolution of the year 2040 is precisely your esteemed China due to its high inequality tending to rise and with a Socialism in decline. I don’t know if this commentator has nightmares or not (we all have them) but I am sure that his study and debate technique that leads him to debate ALL topics (history, philosophy, politics, political economy, etc.) is not enough. successful. Specializing in a single area of study is much more productive and accurate.
There’s no contradiction, because that would mean capitalism would simply enter into a very long and lasting “dark age”.
@ Antonio
If the next cycle of revolutions really start in China, then that would just confirm Marx’s hypothesis that it is the industrial proletariat – not the white collar, middle class, leisure/services working class or the lumpenproletariat – that is the only true revolutionary class. It would debunk the Postmodern theory that stated Marx is “outdated” because today’s capitalism is all about “intangible value creation”.
It would confirm something I’ve been telling here, which is the fact that the Chinese proletariat – being the single largest true proletariat – that is now in the vanguard. That would mean the Western Left is now in the rearguard or plays a secondary role (or, worse case scenario, a reactionary role, in terms of the great movements of History).
”It would confirm something that I have been saying here, which is the fact that the Chinese proletariat, being the real biggest proletariat, is now in the forefront. That would mean that the western left is now in the rear or playing a secondary role (or, at worst, a reactionary role).
It is not a question of the size of the proletariat that decides whether its working class becomes the “vanguard” of socialism, but rather it is a question of social inequality (i.e. rate of exploitation). If the Chinese proletariat suffers a high rate of exploitation then it will be a vanguard and a strong candidate for the next revolution. Just like any other country with a high rate of exploitation. South America, Asia and Africa contain a large number of such countries. Europe and its workers suffer less relative exploitation and the probability of revolution is low, although not non-existent. The wishes and ideas of the working classes are conditioned by the objective and economic conditions created by the ruling class and that is what leads them, or not, to the socialist vanguard or rearguard.
On the other hand, and contrary to your argument of a current socialist China, if the Chinese proletariat suffers a high rate of exploitation (and that current exploitation is true given its high Gini index) the country should not be very socialist, right? It should no longer even qualify the country as socialist if it admits that it has a large mass of proletarians. Existence of Proletariat is equal to existence of Capitalism. In addition to multiple other economic indicators, especially the privatization of the state economy, which indicate that China is heading (if it is not already) at high speed towards Capitalism.
“This infusion of cash to the “little people” triggered a sudden spike in demand, which translated into a correspondent spike in imports of goods from China. This process only worked because the USA is the financial superpower, therefore it issues the universal fiat currency (the USD).”
Except… there was NO spike in US imports from China in either 2020 or 2021. The US Department of Commerce reports import levels annually. So here are the numbers for imports from China:
2017 $505.165 billion; 2018 $538.514 billion; 2019 $450.764 billion; 2020 $434.749 billion; 2021 $456.832.
And the 2021 amount is also less than the amounts imported in 2014, 2015, 2016. So we can eliminate any sudden spike in demand corresponding to a spike in imports of goods from China from the list of “causes.”
As for “additional dollars” in circulation and the impact on other countries, that’s really, really, hard to quantify. Interest rates, affecting debt service requirements, are of much greater significance. Dollars held outside the US are held as foreign reserves and the percentage of the total reserves held in dollars has actually declined since 2000 from about 70 percent to about 60 percent. Also, the portion of marketable US Tsy securities held outside the US has declined approximately 30 percent since its peak in 2008-2009.
On the face of it you are both correct regarding the trade figures. If we turn to the CPB-world-trade-monitor, we find that the volume of Chinese exports, using December 2019 as the base, rose by 30% by the end of 2021. However, when we turn to the import side, the volume of US imports only increased by 9.5%, compared to 14.6% for the EU and 13.8% globally. And yet when we analyze physical air and sea traffic movements, most of the trade was on the Asia North America route. So there is a conundrum even when taking into account queues of up to 180 container vessels outside US ports with a total merchandise value of $60 billion or 10% of imports. (The average container vessel carries about $300 billion in cargo.) It used to be said that god moves in mysterious ways, today it can be said that the multi-nationals move in mysterious ways. Who knows how much of these discrepancies are due to changed country of origin invoicing? https://www.cpb.nl/en/world-trade-monitor-november-2021
It could have been the case where imports in other areas fell, compensating for the flood of low value goods bought by the “little people”.
But, if your assumption on the imports issue is true, then the USA is in a even direr situation than I pictured in my original comment. The diagnosis is the same.
Trade deficit of the USA with China ballooned in this period. I don’t know, I think we should review those data.
There’s no doubt this inflationary wave was caused solely by the USA printing obscene amounts of money. The timing is right and the explanation is sound. Those USDs simply have to somewhere, and they can’t lose purchase power. The only other variable to this would be the collapse of the European energy (gas) market, which restructured some years ago – from long-term, fixed prices deals to “spot markets”.
Don’t think so Brian; aggregated customs values for imports by vessels at all US ports for the group– China, Hong Kong, Cambodia, Vietnam– show 2021 only 3 percent above 2018.
Have you factored in the greater use of airfreight because of port congestion.
Yes, total port figures include air freight.
Rather grandiose hypothesizing that China was not affected by Western economic troubles because it is allegedly socialist. A simpler explanation is that China maintains quite limited convertibility of the renminbi, and with cheap labor for 30 years it has taken over a huge swath of manufacturing – which is a sellers’ market right now.
Cheap labor doesn’t explain why the likes of India didn’t industrialize during the same period.
If cheap labor automatically caused industrialization, then every Western nation-state would already be doing that (precisely in order to contain, to then destroy, China).
China’s labor is more expensive than, e.g. Brazil’s since the early 2010.
The reason most Westerners can’t understand China is socialist is because they have that Cold War mentality which states Socialism is an alternative to Capitalism, when, in reality, Socialism is the successor of Capitalism, it arises from an abundance of capital, not its lack of.
If you still think China’s competitiveness comes from cheap labor, that shows how woefully lack of update you have on China.
“… it’s the slowing down of the major economies and the continued supply bottlenecks in meeting consumer demand that has led to the huge spike in inflation rates.” ->¿Raising consumer demand AND slowing down economies? It’s a contradiction: in capitalist economies augmenting demand takes to augmenting investing, to augmenting production, to cuts in fixed costs now divided among a greater output, to diminishing prices … as long as there is not shortages in labour, raw materials and, last but not least, ENERGY. ¿And what is going on in this field? -> “… energy prices, the main driver of inflation.” -> Energy means conventional oil, it peaked in 2008 (Outlook 2018, International Energy Agency, page 45), we are running out of it, there is no replacement, we are in dire straits.
Question:
The following part of the book by G.E.M. de Ste Croix, has any resemblance to what neoliberalism is doing to capitalism?
“the Roman political system (especially when Greek democracy had been wiped out …) facilitated a most intense and ultimately destructive economic exploitation of the great mass of the people, whether slave or free, and it made radical reform impossible. The result was that the propertied class, the men of real wealth, who had deliberately created this system for their own benefit, drained the life-blood from their world and thus destroyed Graeco-Roman civilization over a large part of the empire…. That I believe,…was the main reason for the decline of Classical civilization.”
G.E.M. de Ste.Croix. The Class Struggle in the Ancient Greek World from the Archaic Age to the Arab Conquests, Duckworth, 1982
Great book
Numbers just came out: USA trade deficit ballooned in 2021. The deficit against China widened by USD 45 billion, while the deficit against the EU widened by USD 35 billion.
They confirm the Marxist hypothesis that the inflationary wave in the USA is happening due to insufficient value to exchange (i.e. the use and abuse of the Dollar Standard), not due to the collapse of Toyotism.
Meanwhile, MMT’s last supporter – the NYT – is apparently losing patience with them. Yesterday, they published a humiliating op-ed on MMT, disguised as an interview with Stephanie Kelton. Larry Summers tweeted about this, calling MMT a pseudo-science (which it is – it takes one to know one, I guess).
Imports from China for years 2020 and 2021 were 5% below the value of the imports in 2018 and 2019 (see today’s Wall Street Journal article).
Imports from Vietnam were up 57% by comparison, which might be an example of Brian’s point about multinational “shuffling” from China, but the increases from Taiwan, Malaysia, Switzerland, Ireland, the Netherlands, So Korea, India, etc cannot be attributed to “re-exports” of China’s products.
In addition, worldwide, growth in export VOLUMES from China turned negative in 2021, according to the CPB report Brian provided, while volumes from Asia excluding China were flat. Much of increase in value of goods traded is attributed to price increases, paced by increases in fuel prices, and with the memory of oversupply still fresh, US shale producers were less eager to pump up the volumes. The US deficit in petroleum trade practically doubled from 2020 to 2021.
From the point of view of the Value Theory, the volume argument is immaterial in this case because what matters is the differential (+-), not the absolute quantity of value.
In this case, you’re merely pointing out that American exports fell more than the fall in imports. The Law of Value still stands (and all of its implications).
VK: “In this case, you’re merely pointing out that American exports fell more than the fall in imports. The Law of Value still stands (and all of its implications).”
No, not according to the US Dept of Commerce Figures (https://www.census.gov/foreign-trade/balance/c5700.html#2018). US exports to China 2021 were at historic highs, and the trade deficit fell from $418 billion in 2018 to $355 billion in 2021.
Yes, the law of value holds; no, I don’t think you’ve used the law correctly to explain the onset of inflation.
BTW on this: “@ Antonio If the next cycle of revolutions really start in China, then that would just confirm Marx’s hypothesis that it is the industrial proletariat – not the white collar, middle class, leisure/services working class or the lumpenproletariat – that is the only true revolutionary class.”
That’s heartening, but if China is indeed “socialist,” then what is the basis for a proletarian revolution starting in China?
You’re comparing 2021 with 2018, instead of 2020 with 2021. Money printing policy started in 2020 (the end of Trump’s mandate), therefore that’s the year of my choosing.
To top it off, 2018 was an exceptional year in terms of deficit vis-a-vis China, so your comparison is even more odd (if you wanted to take into account the last year before the pandemic, you should have chosen 2019 and not 2018). No other year of the series of your source even gets close to USD 400 billion, let alone the USD 418 billion reached in the aforementioned year.
In 1992 (the year of the fall of international socialism), the USA’s trade deficit with China was only USD 18 billion; in 2001 (the year of China’s accession to the WTO and the USA’s invasion of Afghanistan), it was only USD 83 billion.
—
I said “if”. There won’t be a socialist revolution in China. China already is socialist.
The Chinese working classes are witnessing their real wages grow at a pace to instill envy in the most traditional and strongest unions in the West. The numbers don’t lie: the Chinese working class is accruing gains without parallel since the 1990s. No other working class in the world can claim to such intensive and extensive gains. Whatever they’re doing, it’s working, no pun intended. The Chinese proletariat proved the traditional, trade-unionist, social-democratic path is not the only path to betterment of the conditions of the workplace and wages and rights gains.
My prediction is that this present wave of counter-revolution will continue for some centuries, in which the working classes of the West will adopt the path of reaction (chauvinism) instead of the path of revolution. The objective will be to create a large and strong enough force to invade and destroy the last socialist pole – China – in an enlarged version of WWII.
VK,
You need to get your facts straight. You said US exports to China fell off in 2021 than the “fall in imports.” They did not. In 2021 exports were at historic highs, in comparison to 2018, 2019, 2020.
Here’s a question for Michael the economist: Should trade balance figures be adjusted for related party trading?
Related-party trade includes trade by U.S. companies with their subsidiaries abroad as well as trade by U.S subsidiaries of foreign companies with their parent companies. In 2020, related party trading for the US amounted to 47% of imports and 34% of exports. Simply subtracting those related party amounts from US totals (without regard to the parent company’s “home” country) reduces the US trade deficit in 2020 to $276 billion, about 1/3 of the “gross” figure.
Anti-capital, it is discussions like this on fundamental questions which makes me appreciate this site all the more. I used December 2019 as the figure in the CPB analysis because that coincided with the CPB itself setting that month as its base at 100. Of course had I taken 2018 as the average, being the previous peak year, then the data would have been different because in the second half of 2019 there was a significant contraction in world trade. This said, the average monthly volume increase in Chinese exports using the CPB data up to November 2021, was still up 10% compared to the average for 2018. Chinese data indicates this volume growth as well as price rises increased its exports to an annualized rate of $3.5 trillion, an uplift of $1 trillion which in turn raised the mass of profits in China and with it the rate of return in 2021.
This discussion between value and volume is fundamental. In support of your thesis the CASS freight index linked below shows that US shipments were no higher in 2021 than in 2018. It is why I used the data found in the UPS current financial release to show that whereas its revenues had risen by 11.5% it’s price per parcel delivered had risen by 11.3%. This described a picture of price growth not volume growth in one of the world’s largest delivery companies. If we assume that 2/3 of inflation benefited the large corporations and we add this to the direct subsidies they received, then it is probable that of the $5.1 trillion in COVID relief funds, around $2 trillion or 40% was pocketed by non-financial corporations in the USA, which is why the larger corporations are awash with cash, and why I have described this as gaming the system.
There is a single confounding factor. Given the supply shortages, corporations focused on selling their most expensive top range products. This is as true for autos as it is for smartphones. This substitution for top range at the expense of bottom range, would trouble simple volume value calculations.
And yes you raise a good point about US imports being divided into those provided by US corporations and those provided by foreign corporations. This has created a mine field for US sanctions of Chinese entities lest it hurts US corporate profits. One final point, countries with large financial centers such as London and New York will tend to have trade deficits. The System of National Accounts correctly does not capture the flows of fictitious capital thanks to Leontief. But these centers which manage them, benefit from them, and convert some of their proceeds into consumption which is ultimately reflected in the trade figures.
oops forgot the link https://www.cassinfo.com/freight-audit-payment/cass-transportation-indexes/cass-freight-index
The US BEA produces a table “Ownership-Based Framework of US Current Account” (https://www.bea.gov/international/supplemental-statistics) which adjusts the trade numbers, and receipts, for US affiliates of foreign based companies and foreign affiliates of US based companies. Latest “whole” report I could find ends at 2018.
Eliminating all imports and exports between “affiliated parties” (US to/from its foreign subsidiaries, US affiliates of foreign corps) reduces the deficit on the trade in goods and services in 2018 by about half to $280 billion.
Inside-the-firm trade doesn’t matter for the trade balance because the value is still produced by a foreign workforce. If that didn’t matter for trade, the USA would not have any problem with China.
The important thing about inside-the-firm trade is the profit, which always goes to the nation with the HQ.
Conspicuous silence from the left as a workers’ rebellion begins to build momentum across the west….