Today’s jobs figures from the US were not promising. Net new jobs rose 113,000, much less that expected and well below the average for 2013 of about 180,000 a month. But the data are heavily mixed up by revisions to the time series, weather and confusions over how many people have just given up looking for a job at all. Perhaps the best guide to what is going on is provided in this graph.

It shows that US employment levels are now close to the previous peak back in 2007, but it has taken six years to get there, two years longer than any previous recovery, and of course in that time those of working age have grown in number. Six years of way less than full employment is a huge waste of skills, energy and livelihoods for millions of Americans.
Indeed, this Long Depression has been permanently wasteful of the potential exertion of human ingenuity. Output growth in this recovery has been slower than in either of the past two recoveries, despite the much larger decline in output during the recession. There is no sign of any reduction in the enormous gap that has opened up between actual output and trend. The cumulative loss of output relative to potential will approach $6 trillion in 2014, or almost $20,000 for every man, woman, and child in America.

The best measure of economic recovery is not a rise in gross domestic output but in GDP per capita. Germany, whose population is shrinking, is the leader among G7 economies on that measure, followed by Japan. The US and Canada are behind and the UK is only better than struggling Italy.

And the latest high frequency data on the US economy and others that I usually post each month show no particular sign of faster growth, as of January 2014. My measure of US economic activity – the combined measure of manufacturing and services – for January shows that the US economy continues on a low-growth path.

The even more frequent, but more unreliable, weekly ECRI indicator is also in that range – although it seems to be moving up. By the way, ‘boom’ conditions would imply real GDP growth faster than the long-term trend (for the US at about 2.5% a year). Neither indicator is showing that yet, although that is the consensus forecast for the US this year.

If we look at the rest of the world, it’s a mixed picture. Everywhere is growing, but the pace of growth is slightly up for the world measure, but slower in the US, the UK (down from a previous fast pace of recovery) and China. The Eurozone and Japan were accelerating a little in January. Anything above 60 would suggest ‘boom’ conditions.

It seems that stock market investors are getting worried. The stock market is really a barometer of opinion on the prospects for profits (after taxes and interest paid). In 2013, the US stock market jumped 30% from the end of 2012. The 2013 gain brought the cumulative increase in the stock price index to 170% since the trough of March 2009. That would suggest increased confidence in corporate profitability and, as this blog has shown on many occasions, that confidence was justified by the sharp increase in the mass of profits in the US, in particular, over that period.
But I still reckon that this is what is called a bear market, namely one when stock prices are generally weak and/or falling (see my previous post from last year, https://thenextrecession.wordpress.com/2013/03/30/its-still-a-bear-market/). Why do I say that? Well, look at the US stock market against GDP – a measure used by the world’s most successful investor, Warren Buffet.

Although the stock market has made huge strides since the trough of 2009, it is still (in GDP terms) well below the extravagant peak of 2000 and only just back to the level of 2007 and no higher than in 1998.
Another measure of the stock market’s value is what is called Tobin’s Q, named after the leftist economist James Tobin. Tobin’s Q measures the market value (or capitalisation) of the stocks of the major corporations against the replacement value of the tangible assets. Tobin’s Q shows that the bear market still rules.

Yet another measure of the stock market’s value relative to the production of real value is its price to corporate earnings after inflation. Gary Shiller has developed such a measure smoothed out for a ten-year average. Again it’s the same story.
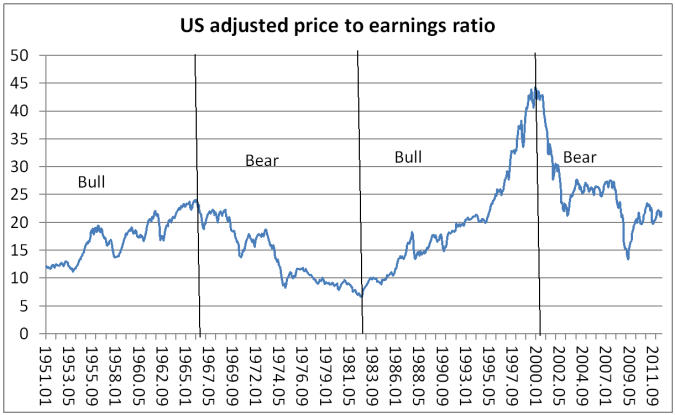
You can see that the huge recovery in stock prices since March 2009 is still not really significant relative to the fall in prices after 2000 and relative to corporate earnings or the value of corporate assets. And you can see that the bull and bear markets follow with a little lag the upward and downward movements in profitability in post-war US capital accumulation. This current bear market reflects the downward trend in profitability since the late 1990s (interspersed with short bursts up) in most major economies.
Since the beginning of this year, world stock markets have been weakening. Indeed, the US S&P 500 index posted losses in nine of the past thirteen business days, registering a cumulative decrease of 5.2% by 5 February. What is this telling us about profits and the ‘real’ economy? Either investors are just ‘taking profits’ temporarily, as it is called, or they are beginning to lose confidence in the future profitability of the capitalist sector.
There are reasons for investors to be worried. First, the huge boom in the stock markets in the last four years is way above even the substantial rise in the mass of profits in many major economies since the trough of 2009. Using Shiller’s data, you can see that the return (in corporate earnings) against investing in the stock market rose to highs by late 2011. But since then it has been falling back as stock prices rose much faster than earnings could keep up.

What has kept things going has been the very low level of long-term interest rates, deliberately engendered by central banks like the Federal Reserve around the world, with zero short-term rates and quantitative easing (buying financial assets with credit injections). The gap between returns on investing in the stock market and the cost of borrowing to do so has never been higher, on Shiller’s data.
These gains are mostly fictitious, driven by low interest rates and credit expansion. Emerging economies also experienced a boost to growth (and inflation) from the transfer of these cheap funds to their markets. But as I outlined in a recent post
(https://thenextrecession.wordpress.com/2014/01/25/emerging-market-crisis/),
the expansion there is now being revealed as fictitious too, as growth slows in the large emerging economies and as the Fed starts to reduce its injections of credit into the financial sector globally.
The World Bank has recently published an estimate of the impact of quantitative easing. It found that 60% of the increase in private capital flows from advanced capitalist economies to emerging ones in the recent recovery was due to central bank credit injections and not based on improved corporate earnings.
The World Bank data also show that the flow of foreign direct investment globally relative to investment domestically has not recovered – and we know that investment domestically in most major economies remains in a slump.
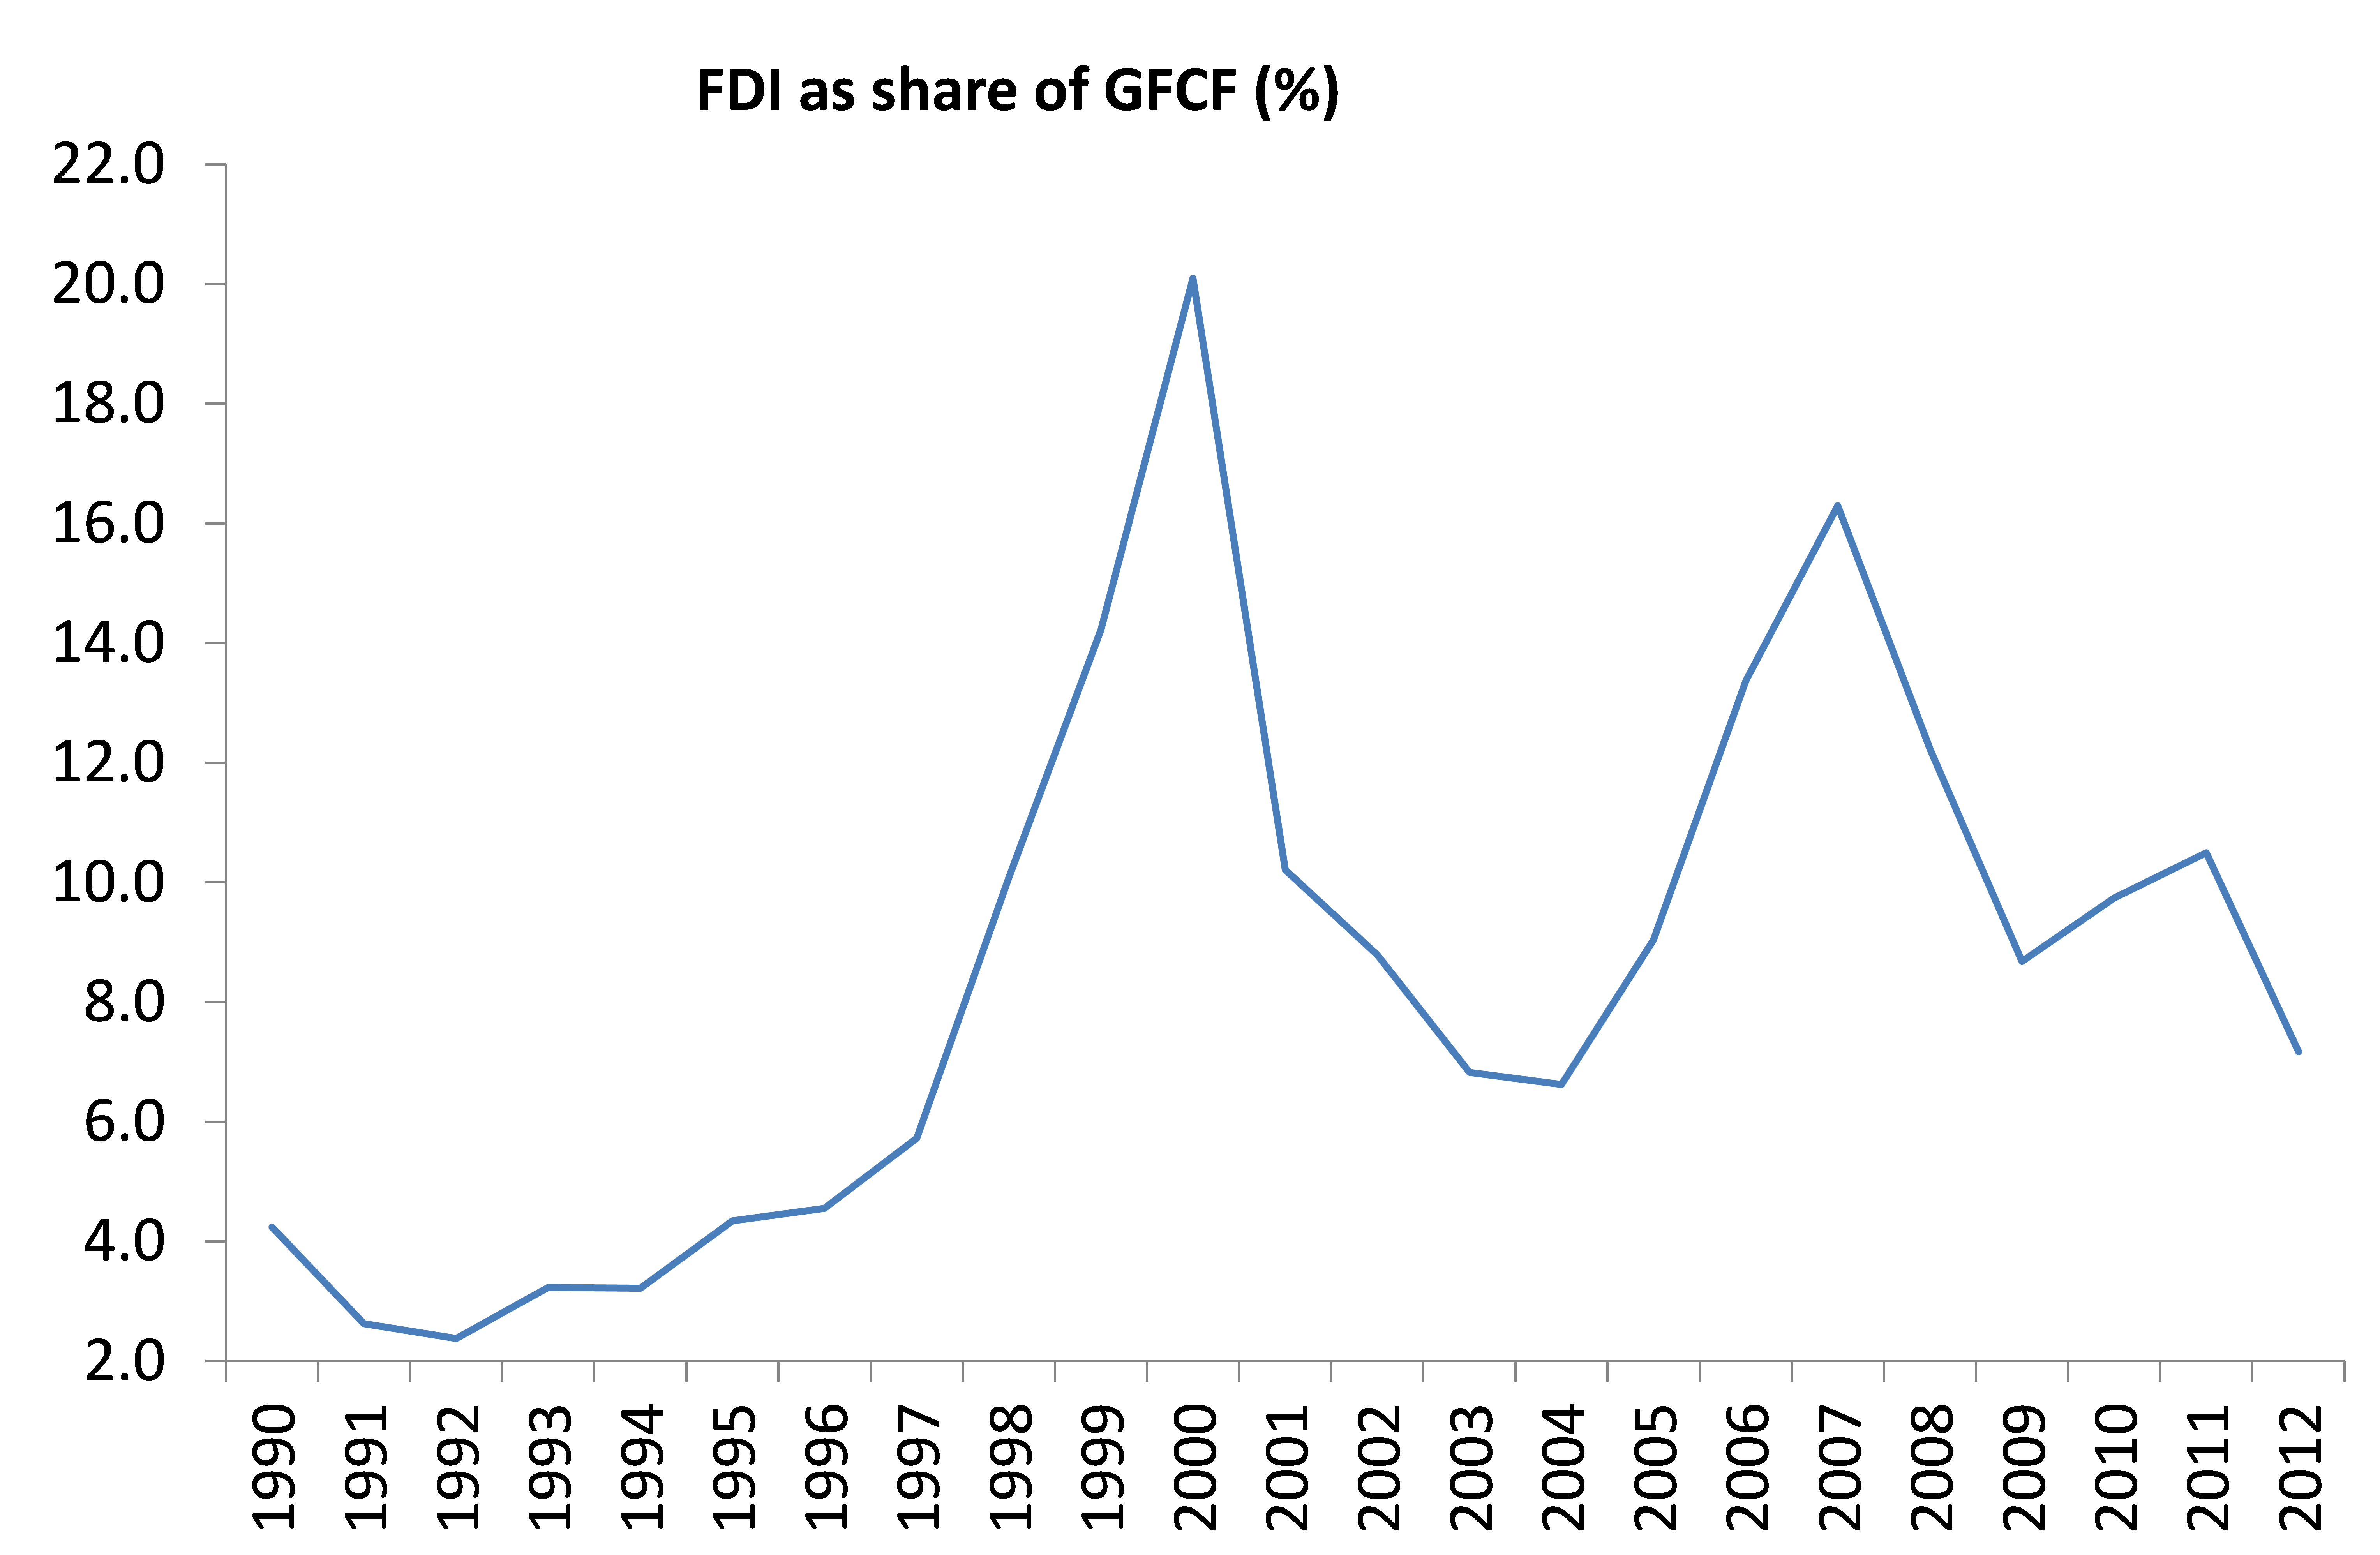
Stock markets may have been booming but tangible investment in the productive sectors of capitalism has not.
Why? Well, the United Nations Commission on Trade and Development (UNCTAD) published its World Investment Report recently (wir2013_en) and revealed that the problem is due to a failure in the recovery of returns on corporate investment globally. Yes, profitability on investment in productive sectors of the world in 2011 (the latest data available) was some 20% below where it was before the global financial crash and the Great Recession for the advanced capitalist economies – and 15% down for the world. Note doubt it recovered a bit more in 2012 and 2013, but it will still be below pre-crisis levels in most of the world.

The recent turn down in global stock markets may be the result of investors beginning to reckon that the investment party is over and the world economy has reached a peak in the pace of this weakest ever economic recovery.

What is interesting looking at the market value/GDP. Tobin’s Q, or the CASE is the fact that there is in each case pretty much the same 20 year cycle. From 1960 to 1980 falling stock prices, 1980 to 2000, rising stock prices, 2000 – falling stock prices.
I have been doing some work over the last year looking at precisely these relations between the real economy and asset prices (stocks, bonds and property), and what is apparent is the extent to which they tend to move not exactly in opposite directions, but that in periods of stronger growth, they rise less than in periods of lower than average growth. This is true even taking account of inflation.
Whether in the US or UK, for example, the data shows that its clear that the real bubble in share prices and property prices arose not as many believe over the last decade, but in the 1980’s. The money printing of the last decade has only managed to keep the bubbles inflated during that period pumped up rather than to significantly inflate them further. Given that global interest rates are rising, and the emerging market currency crisis is a reflection of that, its likely that these inflated asset prices will have to deflate considerably further to revert to the mean.
Its quite understandable why this relation exists. In periods of higher than average growth, a higher percentage of potential money-capital is advanced as productive-capital, rather than being consumed unproductively by the exploiting classes. Some of that will be manifest as additional shares and bonds issued by companies. The additional supply of shares and bonds acts to reduce their price at a time when less potential money-capital is being used for speculation. The same factor acts to raise interest rates, and during such times, the state is also likely to make calls on available money-capital for the purpose of restoring infrastructure etc.
During periods of lower growth, the rate of profit may rise, but less money-capital is used for productive investment. Instead, with low and falling rates of profit and sizeable capital gains to be had from speculation, the money goes into the stock and bond markets. Companies, especially where this benefits their Executives, use available profits and cash hoardes for speculation themselves, for example in M&A, or simply to buy back the companies own stock, thereby ramping up the share price and the value of Executives share options.
Correction: In the last paragraph it should read “low and falling rates of interest” not profit.
“Either investors are just ‘taking profits’ temporarily, as it is called, or they are beginning to lose confidence in the future profitability of the capitalist sector.”
I don’t think you can make these assessments on that basis any more. The NASDAQ bubble inflated without there being any consideration about whether any of the companies into which vast amounts of speculation was undertaken would make profits. What drives markets under such conditions is not the potential for profits, but the potential for capital gains.
The same thing is true about property. people have not been blowing up huge speculative bubbles in property because they expected to make large amounts of money in rent. They have done so, because they expect there always to be a “bigger fool” who will always pay more for a piece of property than they paid themselves. That is true whether we are talking about the ordinary person buying a house in which to live, or the groups of speculators buying up apartments that remain empty in London etc.
Look at the shares of say Amazon, whose p/e multiple is astronomical, and is so because of the perceived potential for it to go higher, not because of any flow of profits. In fact, the “Daily Reckoning” financial website always used to refer to Amazon as “The River of No Returns”.
“What has kept things going has been the very low level of long-term interest rates, deliberately engendered by central banks like the Federal Reserve around the world, with zero short-term rates and quantitative easing (buying financial assets with credit injections).”
This sounds like a very Keynesian rather than Marxist position. If the state has this god like ability to set interest rates, rather than as Marx says, interest rates being set in the market as a consequence of the demand and supply for money-capital, then the consequence would be that the state can intervene in other such ways to determine prices, and control economic activity!
Interest rates have been falling since 1982, because as Marx describes the supply of money-capital (volume of profits) has been rising faster than the demand for money-capital (investment in productive-capital). Not because of any Keynesian or even Monetarist belief in the power of the capitalist state to regulate economic activity via interest rates. All the printing of money tokens by the state can achieve, as Marx sets out, is a devaluation of those tokens, which is one reason asset prices have been inflated massively over that period.
The proof of that can be seen in the rising global interest rates, despite not only continued, but even increasing amounts of money printing. The federal reserve continues to print $65 billion every month, but its interest rates have nearly doubled over the last year. Last year, Japan announced that it was going to double its money supply, and in a month some of its interest rates trebled! Why because increased money printing, a destruction of the value of the currency means inflation down the road, which means lenders get paid back in funny money, so they demand to be compensated by higher rates. That is what is behind the EM currency crisis. Even a slow down in US money printing means the $ rises relative to these currencies. A devalued currency means higher inflation, so Turkey has to raise its interest rates by 50%, and its followed by a series of other countries in a similar boat.
Michael,
I came to this discussion, given your links in another post of yours
It looks like the Buffet measure is well above the 2007 peak (the last peak in this post was in feb?). Also, It seems that the other measure point out a crisis very closer to the crash, or just are capable of sense the intensity of it. But Buffet is much better to detect peaks, thought is not able to sense the intensity.
But, what is the immediate trigger of the bubble now?