This time last year, I outlined the results of the Global Wealth report published by Credit Suisse Bank (see my post, https://thenextrecession.wordpress.com/2013/10/10/global-wealth-inequality-10-own-86-1-own-41-half-own-just-1/). Compiled by Tony Shorrocks and Jim Davies, formerly at the UN, the report last year showed that the top 1% owned 41% of all the personal wealth in the world; the top 10% owned 86% and the bottom 50% of owned less than 1% of all the wealth. This staggering level of inequality certainly attracted interest and my post on this was the most popularly viewed one on my blog ever.
Now Credit Suisse have published its 2014 report (cs_global_wealth_report_2014_vF) compiled by the same academics. According to the latest calculations, global wealth inequality has got even worse. Taken together, the bottom half of the global population still own less than 1% of total wealth. And the richest 10% still own more or less the same, now 87%. But the top 1% now own 48% of all global personal wealth! If you like a soundbite: the top 1% of adults in the world own nearly half of all personal wealth. There seems to be no stopping the growing inequality of wealth in the world.
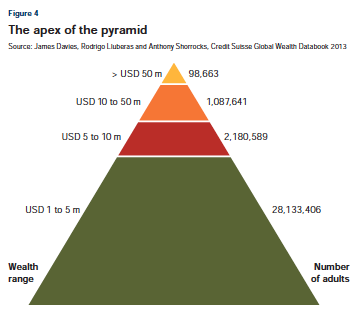
The latest analysis comprises the wealth holdings of 4.7 billion adults across more than 200 countries – from billionaires in the top echelon to the middle and bottom sections of the wealth pyramid, which other studies often overlook. It really is the most comprehensive and revealing account of global personal wealth.
The funny thing is that it does not take all that much wealth to get into the top 1% or top 10%, Once debts have been subtracted, a person needs only $3,650 to be among the wealthiest half of the world’s citizens. However, about $77,000 is required to be a member of the top 10% of global wealth holders and $798,000 to belong to the top 1%. So if you own a home in London (average value now $750,000) on your own and without a mortgage, you are part of the top 1% and many people can claim to have $77,000 worth of property after the mortgage in the US and Europe. Do you feel rich if you do? This just shows how poor the vast majority of people in the world are: with no property, no cash and certainly no stocks and bonds!
Global household wealth has now reached $263 trillion, or about four times the annual product of the world’s working population. The average wealth per adult is now $56,000, a jump of $3,450, or the biggest annual increase since the global financial crisis. Global wealth now stands 20% above its pre-crisis peak and 39% above its 2008 low. On a regional basis, North America and Europe led the gains with increases of about 11%. In contrast, aggregate wealth in Latin America was largely unchanged, whereas Asia-Pacific (including China and India) recorded a small rise of around 3%. Excluding Japan, the region recorded a gain of about 4%, with Chinese wealth rising by 3.5% and Indian wealth falling 1%.
The number of dollar millionaires has increased significantly since 2000, rising by 164% over the period, to 34.8 million. The US has 41% of all global millionaires. According to the report, the number of global millionaires could exceed 53 million in 2019, a rise of more than 18 million. China could see its number nearly doubling by 2019, to 2.3 million adults. Brazil and Mexico will underpin the number of millionaires in Latin America, which could reach 921,000 in five years.
What is also valuable in this year’s report is a measure of median wealth (the 50% point in wealth distribution) as well as mean average wealth. Global median wealth has been falling every year since 2010, while mean wealth has been rising. The poor are getting poorer and rich are getting richer. And the top 1% are getting further away from the top 10%.
The report also shows that wealth inequality is much higher than income inequality and this is a worldwide phenomenon. This is important because there is always much talk about income inequality and this being due to people having better education and skills etc. But it is wealth that really matters and that is down more to inheritance and luck rather than skill, something the report discusses.
The report finds that inequality in both wealth and income trended downward globally from the late 1920s to the 1970s and then started rising. This U-shape in the 20th century confirms the findings of Thomas Piketty in his now famous book on inequality, Capital in the 21st century (see my post
https://thenextrecession.wordpress.com/2014/04/15/thomas-piketty-and-the-search-for-r/).
That brings me to a brand new study by Emmanuel Saez and Gabriel Zucman, close colleagues of Piketty, on the wealth inequality in the US since 1913 (SaezZucman2014Slides). The study combines income tax returns with Flow of Funds data to estimate the distribution of household wealth. Again they confirm the Credit Suisse study and Pilketty’s work (which uses the same data) that wealth concentration has followed a U-shaped evolution over the last 100 years: it was high in the beginning of the 20th century, fell from 1929 to 1978 and has continuously increased since then.
Saez and Zucman make the point that the rise of wealth inequality is almost entirely due to the rise of the top 0.1% wealth (the uber-rich) share, from 7% in 1979 to 22% in 2012, a level almost as high as in 1929. The bottom 90% wealth share increased up to the mid-1980s and then steadily declined (see graph below).

And the main reason that happened is that the 90% are now not earning enough to save anything at all, especially to buy property and so build up wealth. The poor (that’s 90% of us) are getting poorer and the super-rich (0.1%) who rule the world are getting very much richer.
PS. I’ll be meeting Tony Shorrocks, one of the authors of the Credit Suisse report, in a week or so; if you have any questions for him, let me know.

Brilliant! I am even angrier than I normally am.How come I can’t smellburning in the streets?!
“.How come I can’t smellburning in the streets?!”
Because ‘we’ are part of the 11%?
Henry’s commentary is telling. Marxism is primary a class analysis. And with asbtract percentages, be them about income or abstract wealth, you don’t get really a class analysis. Even mr Roberts kind of forgets here that what matters is the property over means of production, transportation, circulation, etc. I’m a chilean (pardon my english), and last year i wrote a little article in which i lay out a critique of the 1% theses. I leavve here for the comrades:
http://marxsimoanticapitalista.blogspot.com/2013/04/la-tesis-del-1.html
Hi Lev, No I dont forget – see my post on Piketty. And you are right about the Marxist view. It’s still interesting to know the grotesque level of inequality in the world generated by the capitalist mode of production and the ownership of capital. The individual capitalists are a very tiny group (less than 0.1%); the real power is exercised by them through a network of global multinationals. The concentration of such capital is also huge.
Even though I would regard myself as a Marxists I would certainly not downplay the significance of these reports because they don’t nicely fit into some idea of what class is. Just so you know.
Hi Michael,
Do you mean that somebody who is the owner of $3,650 became part the wealthiest half of the world’s citizens ?
Thank you,
Etienne
> > Once debts have been subtracted, a person needs only $3,650 to be among the wealthiest half of the world’s citizens >
El 15/10/2014, a las 02:06, Michael Roberts Blog escribió:
> >
Yes – amazing isn’t it? But remember that the curve upwards from there gets steeper and steeper until is virtually perpendicular. This figure shows that most people have absolutely nothing: no property, no spare cash, no nothing from day to day, including those at $3650.
Presumably an index more skewed than wealth would be one’s income obtained from wealth (dividends, interest, capital gains, etc., and rent but no imputed rent, Mr. Piketty) minus one’s wage income. So much for that $3,650.
Surely there is a huge elephant in the room here. To my understanding, these statistics can only be based on wealth that is known in the public domain. Known property and share holdings, salaries etc. But what of the secret wealth that is hidden in the 60 or more countries that are tax havens in the World including the City of London and Manhattan?
The wealth services sector boast that since the mid-1990s that they have persuaded 90% of the world’s wealthy to transfer their financial assets to the tax havens where their size and ownership is secret. Moreover, there a significant number of the super-rich who wish to remain anonymous such as criminals, arms dealers, political leaders, dictators, and so on. These are also not included in these statistics or the various rich lists published by business magazines.
We also know that almost all the transnational companies use tax havens for many of their transactions and international transfers in order to minimise their tax liabilities, hide bribery and so forth,
Thus all the figures on inequality, bad as they are, must be a major underestimate of the real amount of wealth held by the rich and the super-rich, and therefore of the real level of inequality.
In the light of this it is possible that the levels of inequality today are much worse today than they were in the 19th Century to which they are commonly compared. Indeed, perhaps they have to be compared with feudal times.
I don’t understand why this important qualification between public and secretly-held wealth is not being constantly made by left-wing commentators to the point where it becomes part of public consciousness.
Pat
Further to my point – is there any possibility of estimating secretly held wealth at least as a percentage of publicly held wealth? Perhaps the occasional exposes that have come out when secret account holdings have been exposed could be used to estimate the rough proportions involved. Perhaps Michael could ask Tony Shorrocks about this when he meets him.
I’ll ask him
Pat
I talked to Shorrocks last week and he reckons that his data capture the hidden wealth globally. That’s because he uses national accounts and not tax data. The latter would not capture tax evading wealth or income but national accounts balance sheets compiled by governments from the banks, stock exchanges and pension funds etc would. So if an oligarch from Russia hides his wealth in property, cash or shares in Cyprus, then the national accounts there would account for the extra wealth in Cypriot banks (from foreign holders, but no names). So he reckons it is covered.
Would you consider signing my petition and forwarding the link to your email contacts, please? http://epetitions.direct.gov.uk/petitions/59495
There is evidence to suggest that those countries with the highest pay differentials have a whole raft of social problems, high crime and wide variation in life expectancy.
The British Government restricted RBS bonuses to 100% of salary despite losses of £8.3bn. The new Chief Executive of the Co-op, is paid £3.5m despite losses of £1.5bn. In contrast Public Sector workers not on the top of their scale did not even get a cost of living increase and those on the top of their scales just 1%.
Mark Carney, Governor of the Bank of England, called on BBC TV, for large chunks of the pay packages for senior staff in the banks to be “deferred for a very long time”. This came after Barclays Bank had increased its bonus pay out by 10% to £2.378bn even though its profits were down by a third to £5.2bn and it intended to make 7000 of its lower paid employees redundant. And that Lloyds had increased its bonuses by 8% to £395m.
Delivering the Richard Dimbleby Lecture Christine Lagarde said: “Demographics and degradation of the environment are two major long-term trends—disparity of income is the third”. “We are all keenly aware that income inequality has been rising in most countries. Seven out of ten people in the world today live in countries where inequality has increased over the past three decades. Some of the numbers are stunning—according to Oxfam, the richest 85 people in the world own the same amount of wealth as the bottom half of the world’s population. In the US, inequality is back to where it was before the Great Depression, and the richest 1% captured 95% of all income gains since 2009, while the bottom 90% got poorer. In India, the net worth of the billionaire community increased twelvefold in 15 years, enough to eliminate absolute poverty in this country twice over”.
The Chairman of Scottish Power, a former nationalised industry, doubled his salary to £10.5m per year in 2011 whilst many of his customers are having to choose between eating and heating. The Chief Executive of Serco which gets 90% of its business from the public sector is reportedly paid £3.15m per year – 11 times that of the highest paid Local Government Chief Executive who has a much broader area of responsibility.
Prof Richard Wilkinson, co-founder of the “Equality Trust” found the bigger the pay differential in an organisation the more sickness amongst the lower paid who also have a shorter life expectancy. And those Countries with the widest pay differential have high levels of crime and a whole raft of social problems.
Few would object to people getting rich on royalties on a patent, best selling book, record sales or building up their own business but surely it is time we restricted the salaries of the highest paid in a pre-existing organisation, whose success is due to the corporate whole, to an agreed multiple of the lowest paid and bonuses to an agreed percentage of profits (not salaries) and shared by all who contributed. The last Chief Executive of Barclays reportedly took £75m out of the bank in the five years leading up to his departure whilst thousands of lower paid employees lost their jobs – Barclays existed before and after his tenure.
Of the FTSE 100 companies which responded to research by The Equality Trust the top to bottom ratio varied from 48:1 to 656:1. The average top to bottom ratio was 262:1.
Perhaps we could learn from Japan which has one of the lowest top to bottom ratios in the world.
Please support the following petition on “pay differentials” HM Government e-petitions. http://epetitions.direct.gov.uk/petitions/59495
From my understanding of your blog, all monies worldwide are in this pyramid? What would it look like if there were different pyramids for each country?
I would not expect “third world countries” to be calculated on the same economic par with that of the U.S., Canada, and European countries. What about the difference between the haves and have nots in the Middle East and those under dictatorships?
I would be interested in seeing a demographic breakdown for those deemed wealthy in these settings. For instance, a co-worker who immigrated to the U.S. from an African nation is middle class here in the US with one home and has put three children through college. In his home country, he is still a tribal chief and owns the homes there, and is considered quite wealthy… So isn’t much of wealth relative to the cost of living and not so much as a power base?
I am middle class “lower” than I used to be, but the fault is not that of the uber wealthy, but of high taxation to pay for the freeloading dregs of society… The poor will always be with us, no matter how much money the poorest person has, someone will always have more, even in a communist or socialist state…
My coworker example should have read three homes in his home country.