The first estimate of third quarter real GDP growth in the US was released yesterday. It showed the US economy expanded by an annualised rate of 4.9%. The Financial Times called this a “blistering pace that, not for the first time, defied gloomier predictions from economists.” US Treasury Secretary Janet Yellen commented that “It’s a good, strong number and it shows an economy that’s doing very well,” and she is “not expecting growth at that pace to continue, but we do have good, solid growth.”
The doomsayers (like me?) have been proved wrong. The consensus is now that is very likely that the US economy would see inflation drop back to pre-pandemic levels without having to go into a slump and so suffer any significant rise in unemployment – in other words, a ‘soft landing’. And assuming that this first estimate of Q3 growth is not significantly reduced in the second estimate in a few weeks, then it seems that the US economy will avoid a slump this year.
But there are some caveats. The headline growth rate of 4.9% is an annualised figure i.e, quarterly real GDP growth in Q3 was actually 1.2% up over Q2, but the US statisticians multiply that by four to get an ‘annualised rate’. No other major economy’s stats are presented in this way. Even so, it is still a relatively strong figure and certainly likely to be faster than any other G7 economy. The rise over Q3 2022 (ie one year ago) was 2.9% – still higher than elsewhere, but not so startling as the annualised figure.
Where is this growth coming from? Most of the faster growth in Q3 came from 1) higher consumer spending on health, utilities and durable goods 1) a rise in stocks of inventories and 3) from a sharp rise in government spending.
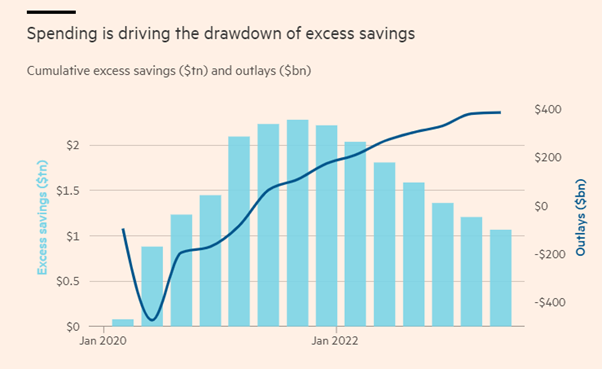
American households have continued to spend more. That’s partly because unemployment is low and Americans are getting wages from work. As the inflation rate has fallen back, for the first time in two years, real wages have now started to rise. Americans are also using savings built up during the pandemic lockdowns to sustain spending. But these ‘excess savings’ have now been run down.
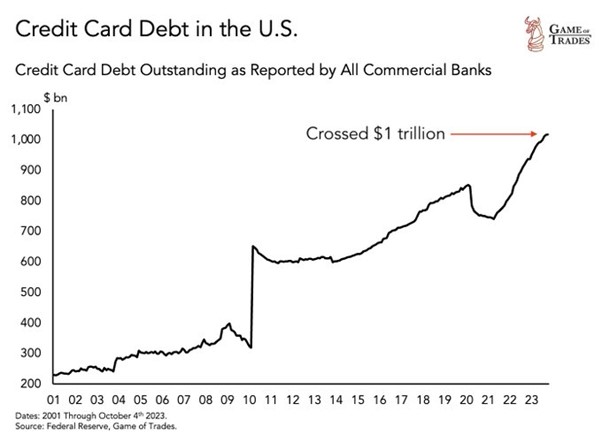
As a result, households are running up debts (credit cards etc) to sustain spending.
So it is unlikely that the US consumer will contribute as much to future US real GDP growth.
Then there are inventories or the stock of unsold goods. In the Q3 growth figure, inventories contributed 1.3% pts of that 4.9% headline rate. That tells you that even though the US consumer is still buying more, unsold sales are building up and companies will have to slow production in future to run down existing stocks.
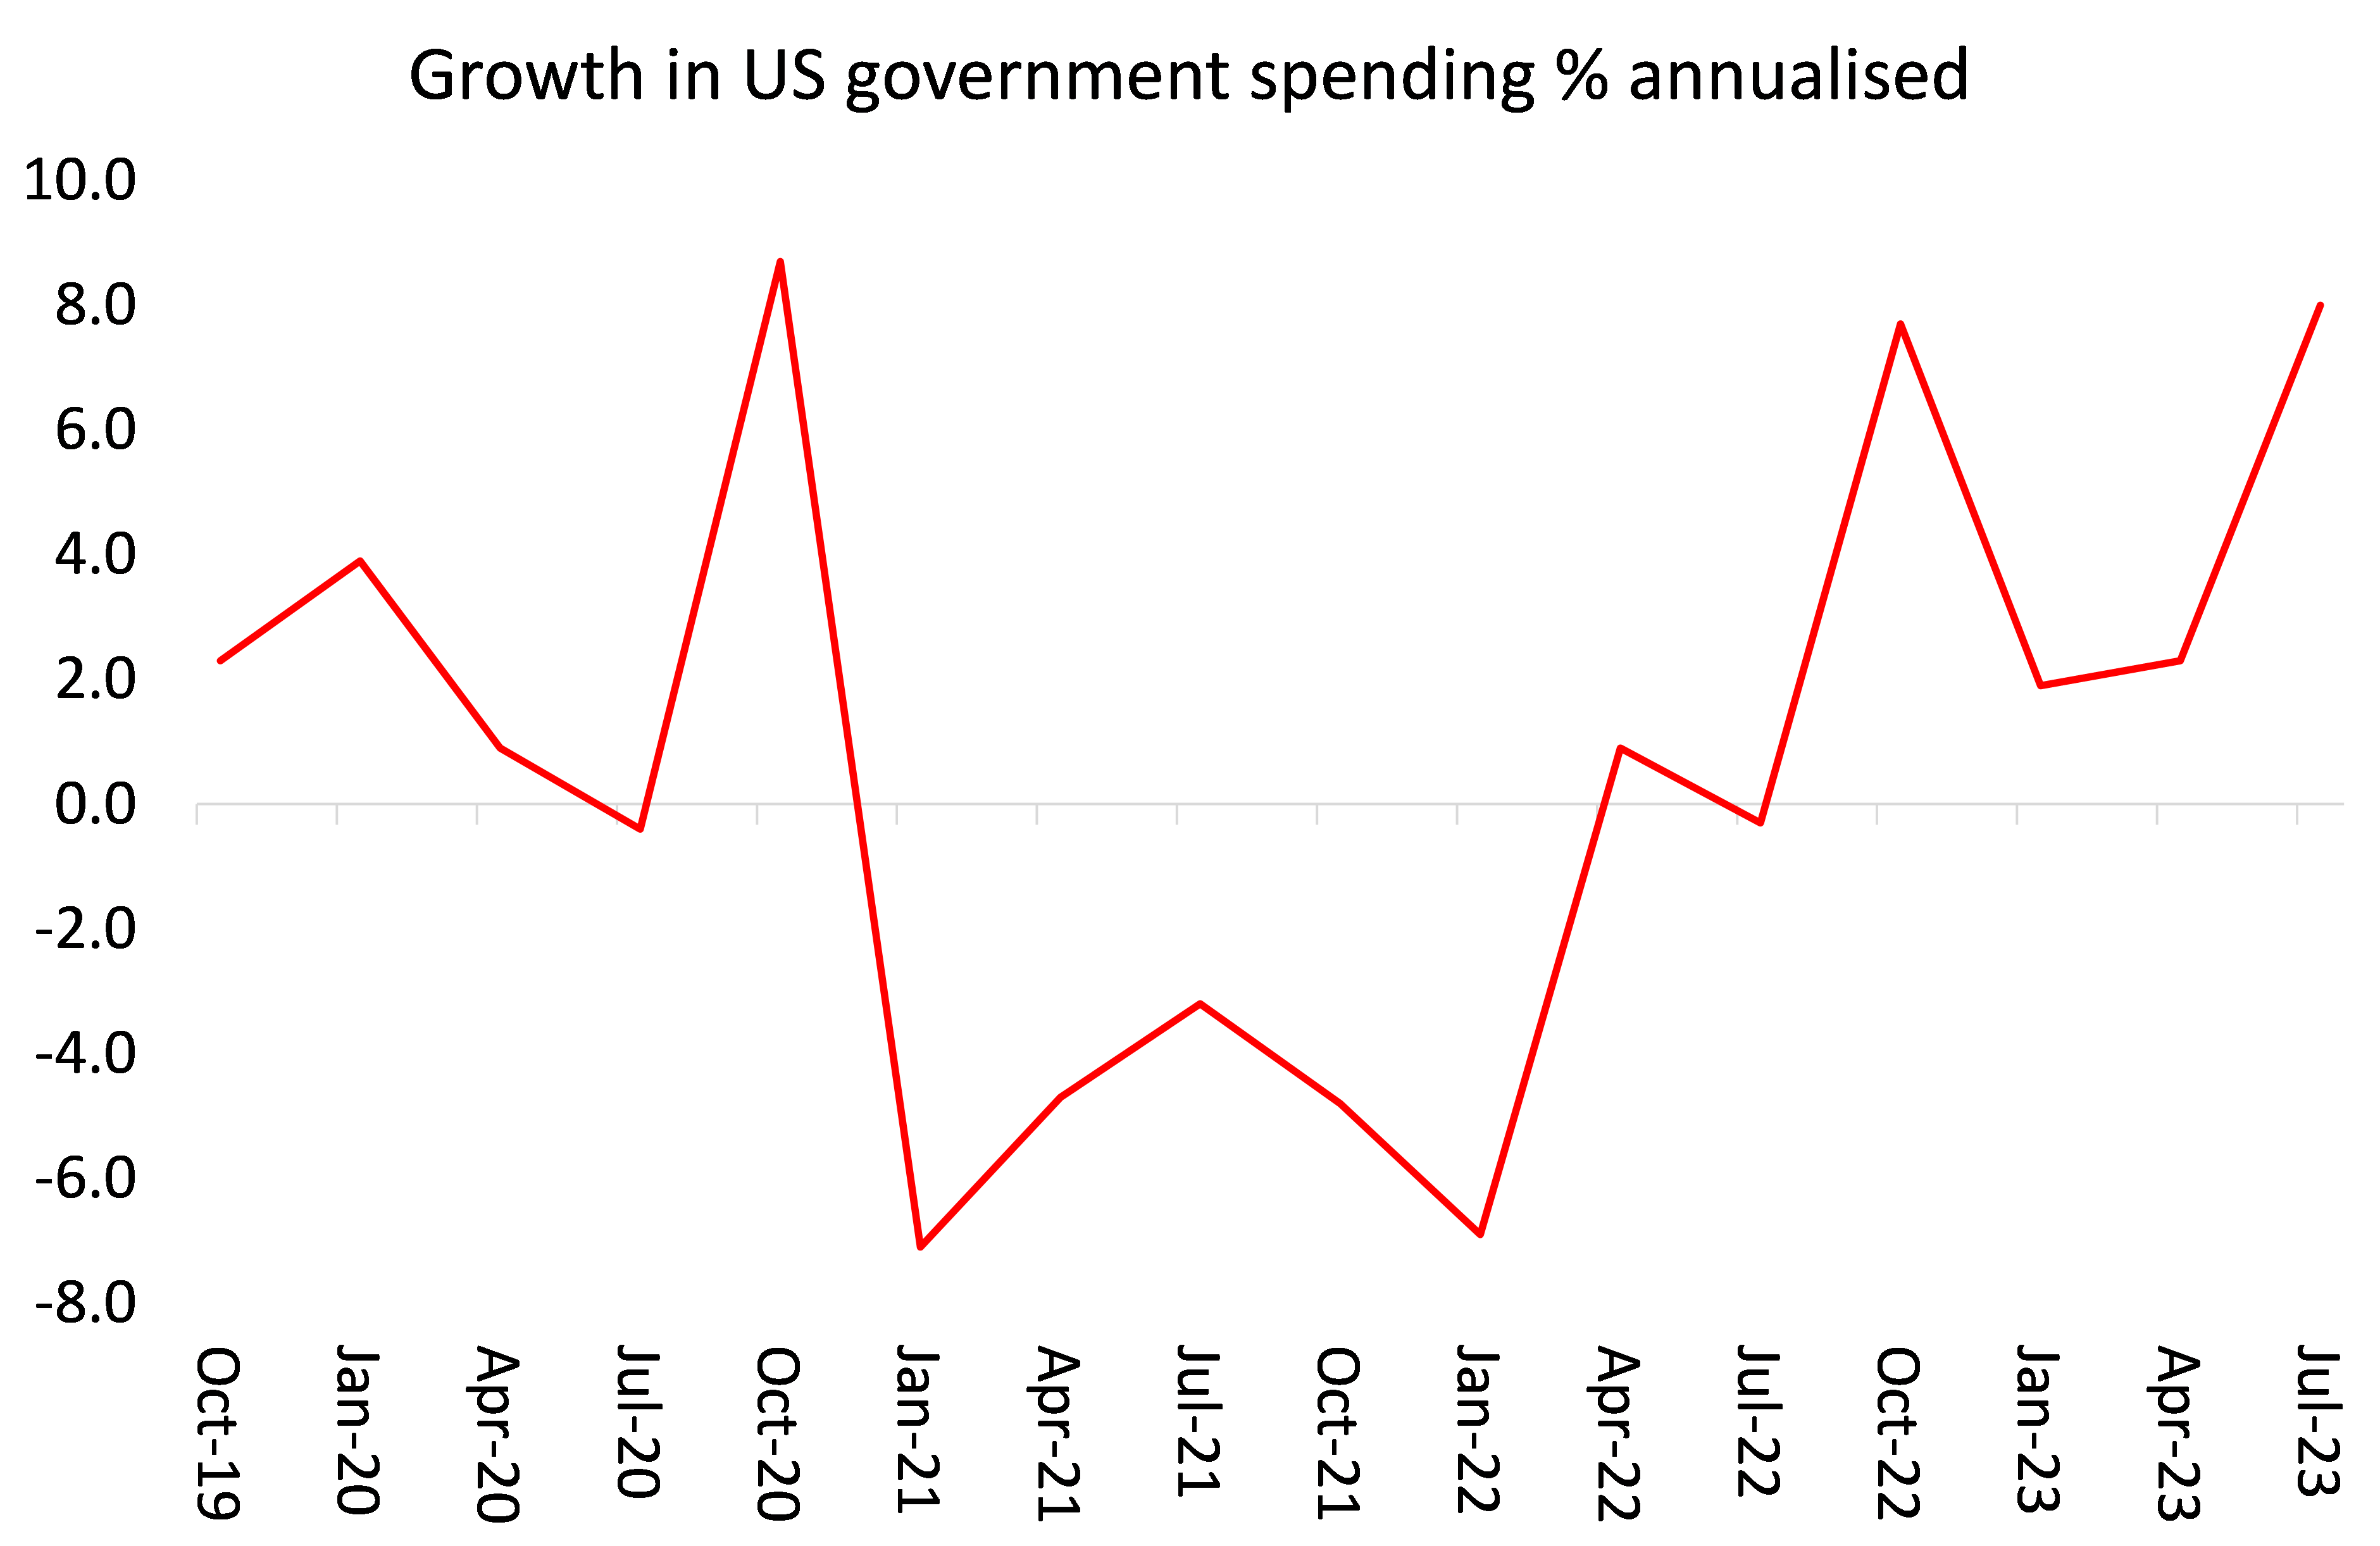
Another large contributor to Q3 growth was government spending and investment, some 0.8% pts of that 4.9%. In previous quarters, this spending increase was for infrastructure. But in Q3, there was a very sharp increase in spending on arms and other military activities.
If we just look at the core drivers of economic growth in a capitalist economy ie consumption and investment, then the annualised growth rate is much less than 4.9% – or 2.5% annualised.
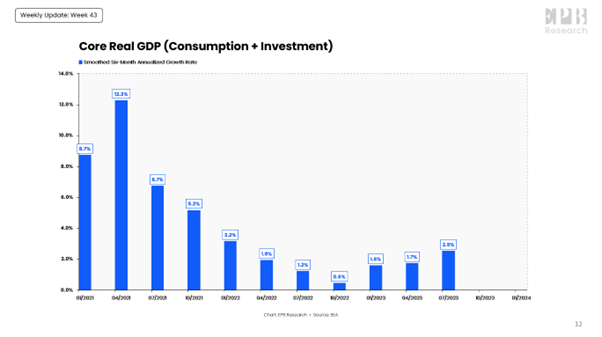
Those core drivers did pick up a bit in Q3, but is that likely to continue in Q4 and into 2024? Well, personal consumption growth is likely to slow as ‘excess savings’ disappear and rising interest rates on loans and credit cards force households to reduce borrowing. And that applies even more to business investment, the productive part of investment.
Changes in business investment have always been an indicator of future growth in output and employment – not vice versa, as Keynesians argue. And in Q3, business investment came to a standstill. In previous quarters it was investment in new structures (offices, manufacturing plants etc) that kept business investment contributing about 1% pt to quarterly growth. But in Q3 that has evaporated.
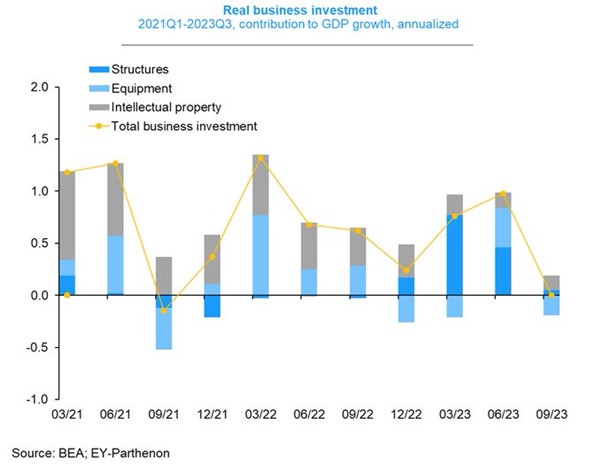
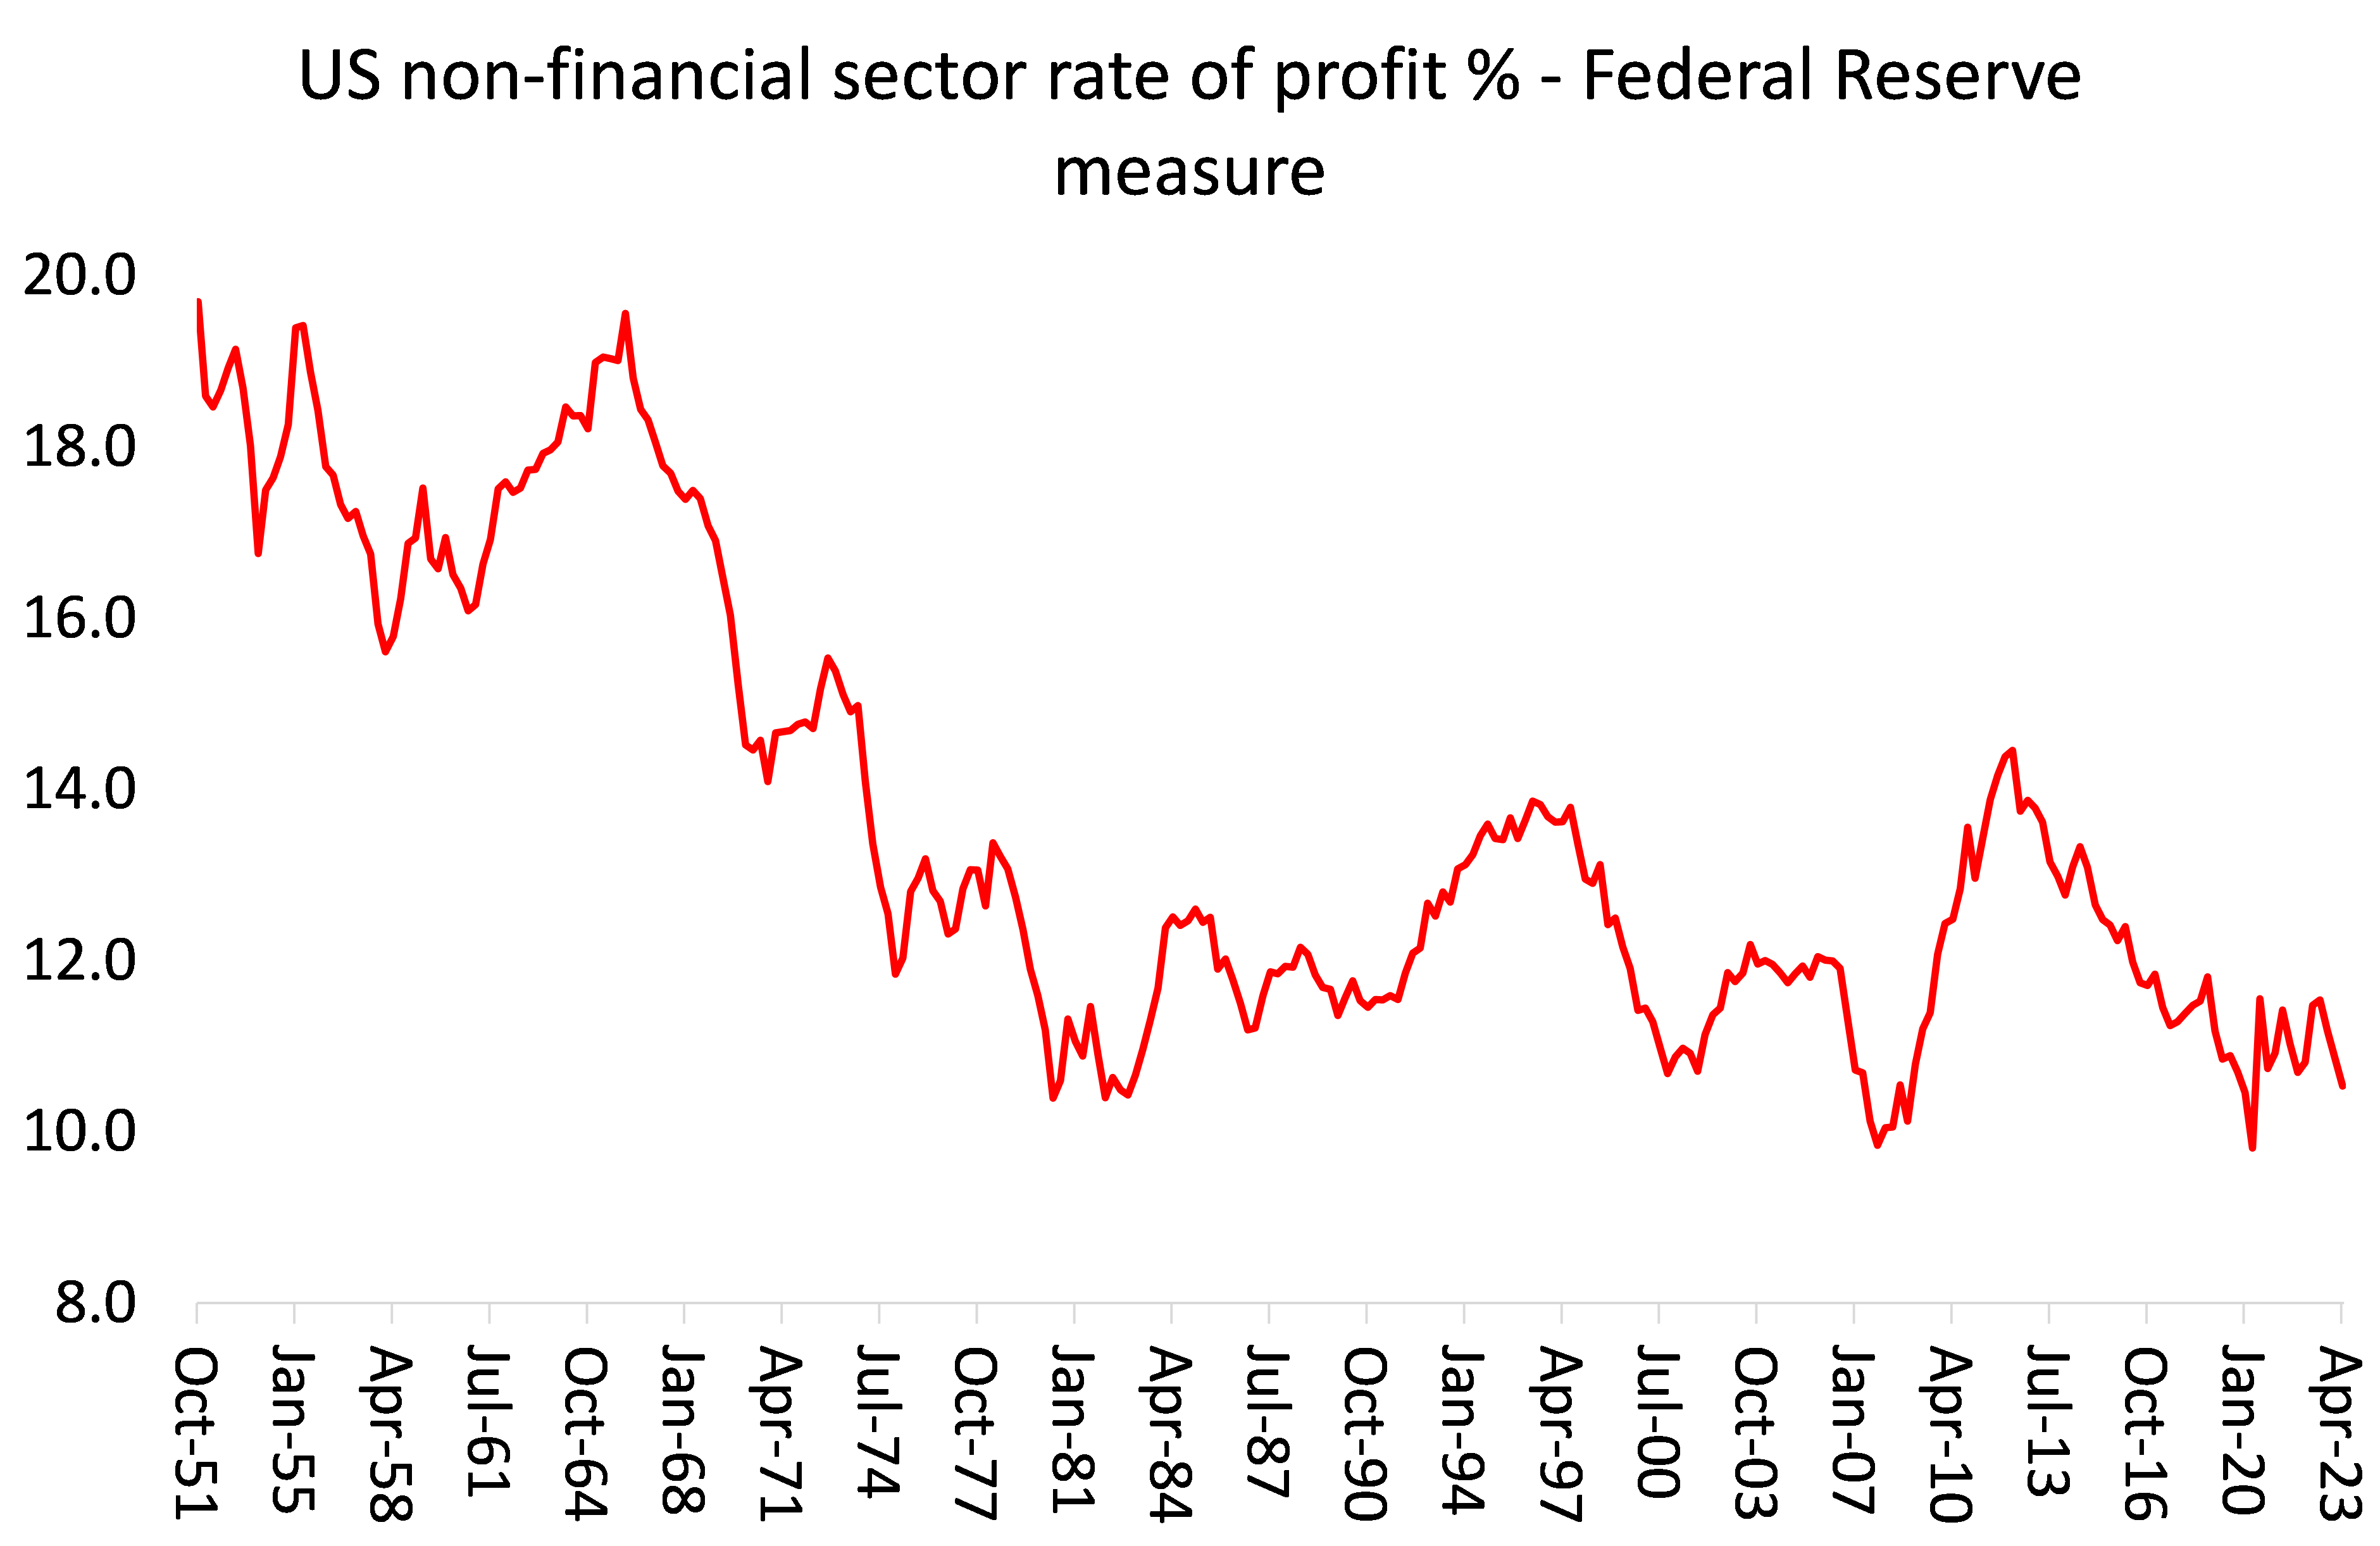
Why? Two reasons. First, the profitability of investing in productive sectors of the economy, unless subsidised by government tax handouts etc, is very low. So there is no incentive to invest.
And second, rising interest rates caused by the Fed hiking its policy rate, supposedly to control inflation, has increased borrowing costs to levels not seen since the 1970s. Indeed, Goldman Sachs point out that the number of unprofitable firms reached almost 50% of all publicly-listed companies in 2022. The share of business activity that they account for is much smaller, but still an economically meaningful 10% of total business revenues and 13% of capital spending and employment. GS comments that “higher funding costs could force some of these companies to cut labor costs or even close. Unprofitable firms tend to cut capital spending more aggressively when faced with margin pressure, and we find they also cut labor costs more aggressively when hit with interest rate shocks.”
So if personal consumption growth is set to slow into 2024 and business investment to fall absolutely, then this Q3 data will be the last good news for the US economy. And as I showed in my September post, A soft landing?, there are other signs of slowdown. Job vacancies are declining; an increase in hours worked by those in work has slowed to a trickle. Most forecasters now expect US GDP growth to fall to an annualised 0.8% next quarter and then down to 0.2% growth in Q1 2024.
Moreover, the consensus may be for a soft landing in the US, but globally that is not so. A reliable high frequency guide to current economic activity is the so-called purchasing managers’ index (PMI) – surveys of companies’ sales, orders and employment. The composite PMI shows the level of activity in both manufacturing and service sectors. Anything above 50 means expansion; anything below means contraction. The latest October PMIs show that the world economy is teetering on recession, with only the US, India, China (and the war economy of Russia) still expanding. Nearly every other major economy is contracting on this measure in October.
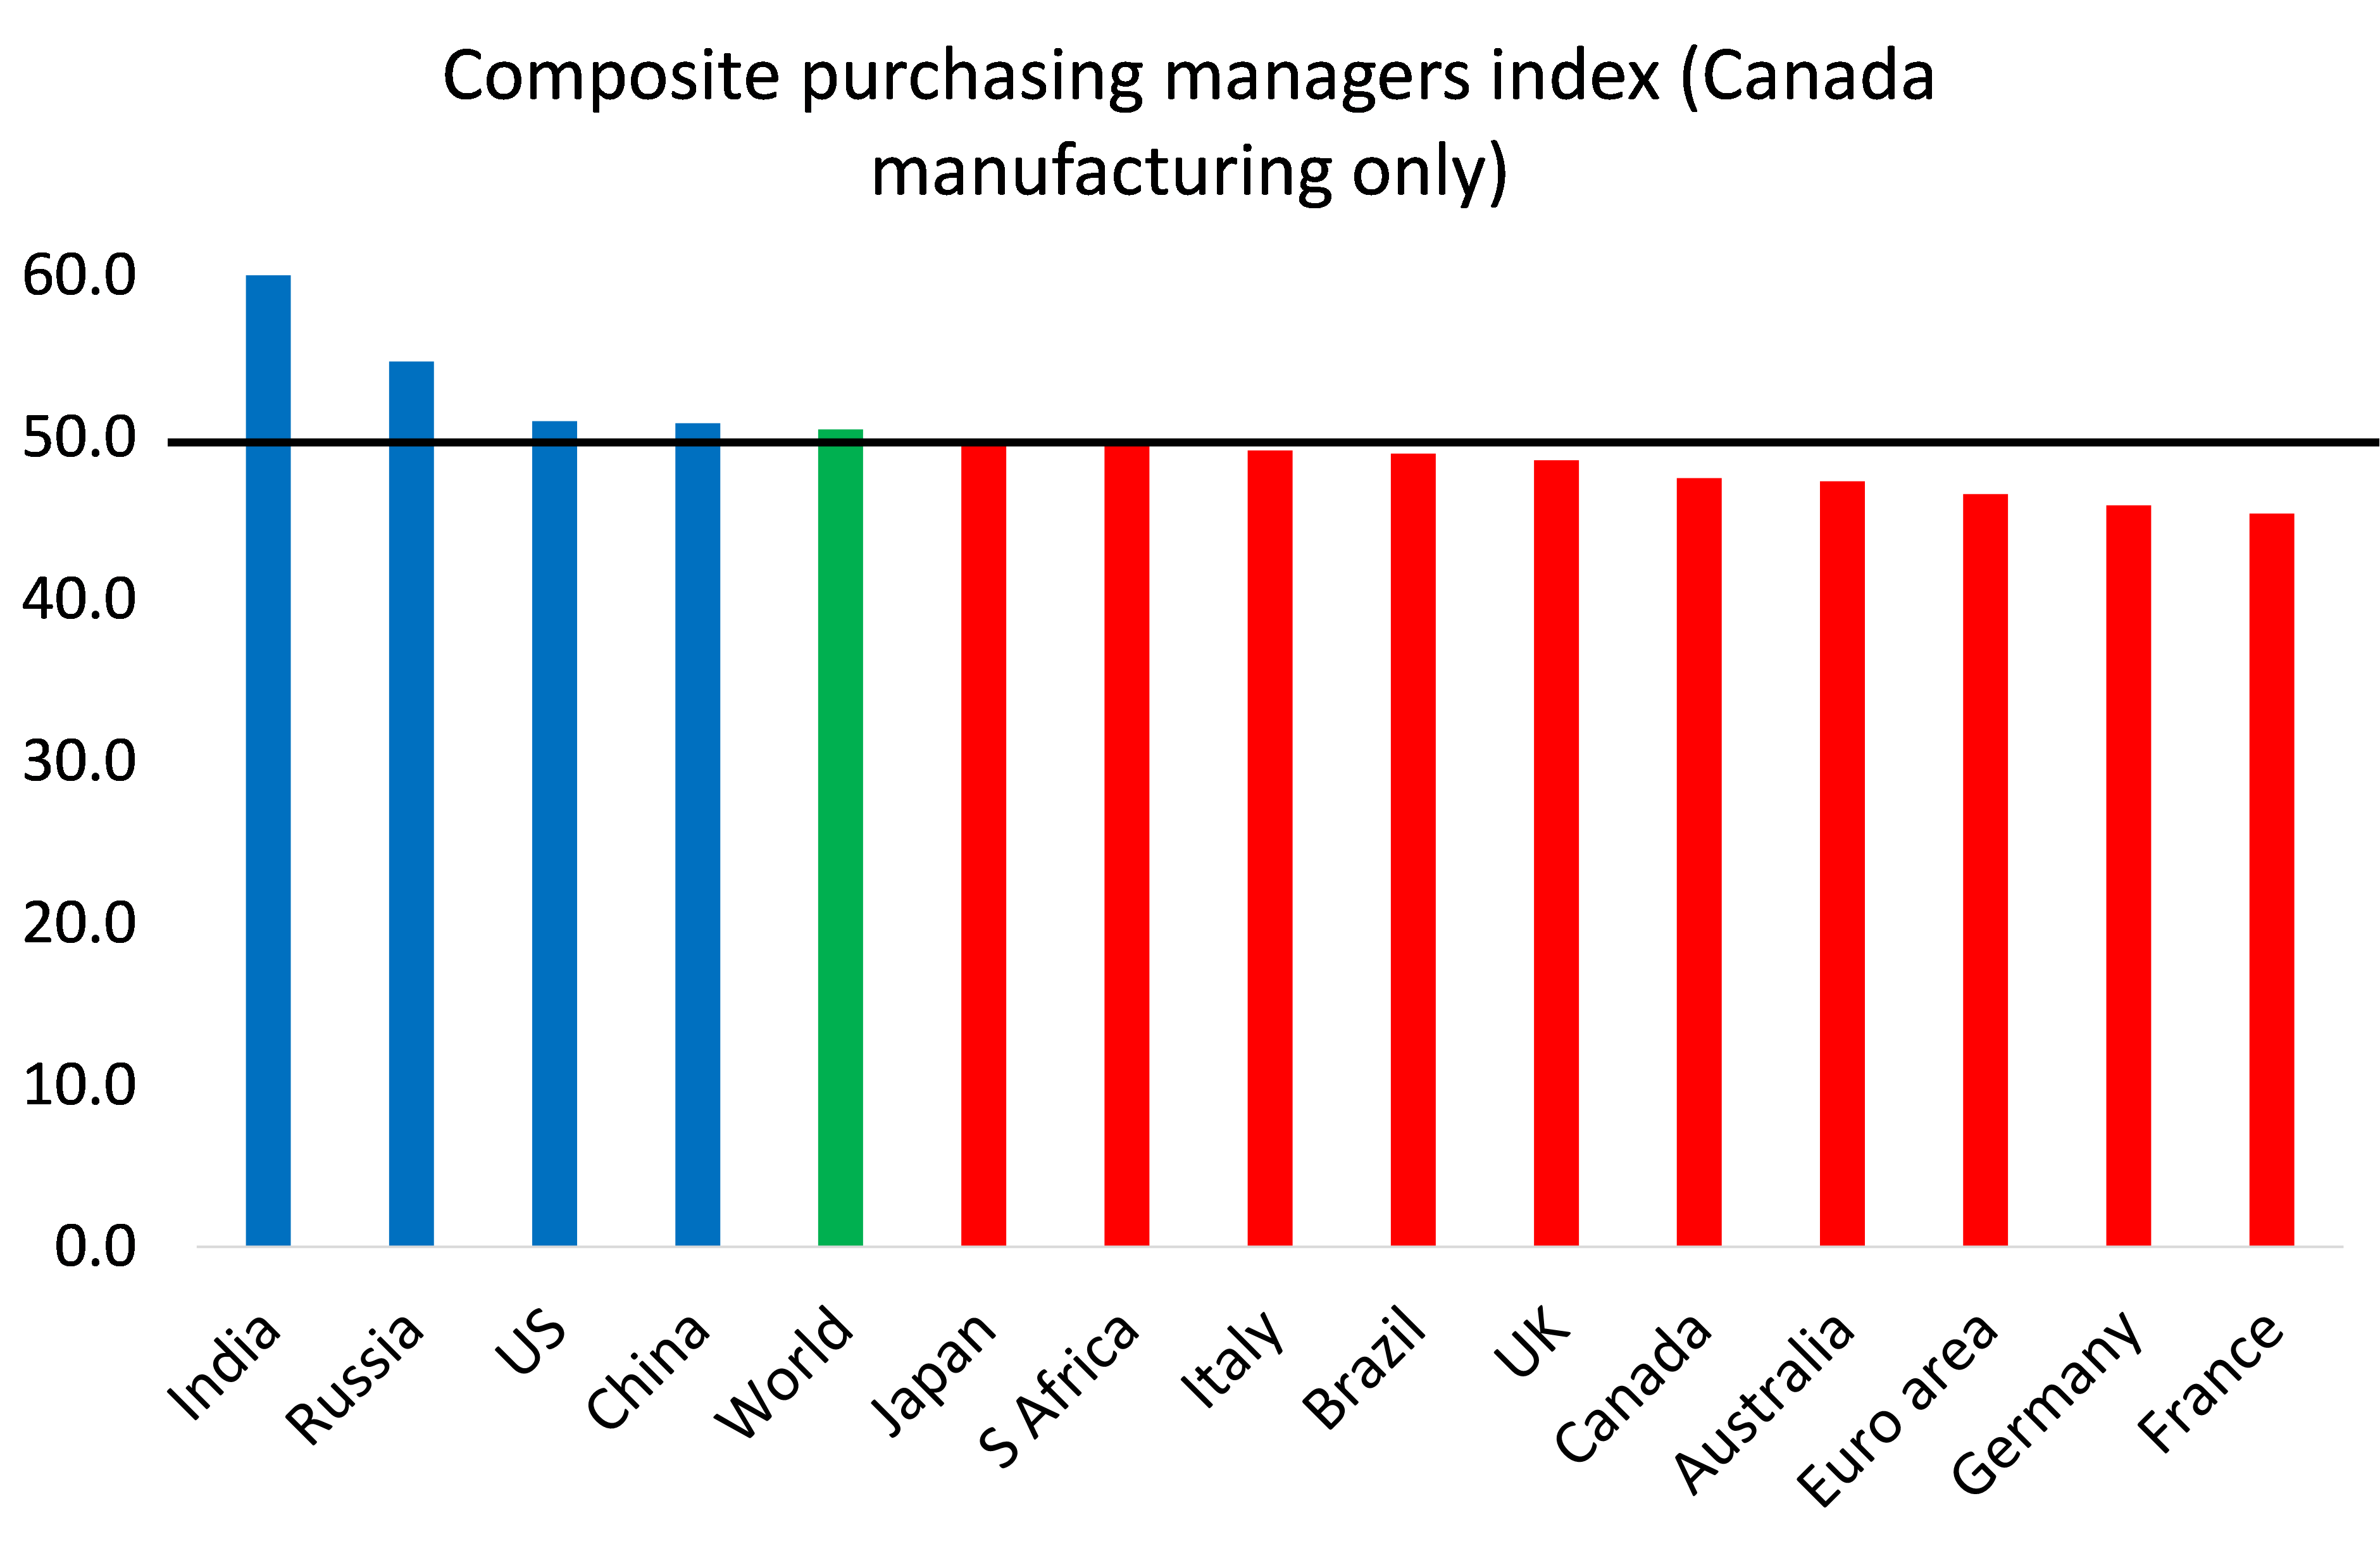
The US may have been expanding in Q3, but most of the rest of the world was contracting; and in 2024, they may be joined by the US.

The USG is just making up numbers at this point. It is pretty clear that the American economy did not grow 4.9% this trimester.
There are, currently and besides the obvious factor of the Dollar Standard, two main counteracting factors to American collapse:
1) As an empire, the USA can drain wealth from its provinces (allies); that is, almost the entire Third World and its First World “colleagues”. That means the provinces will decay before USA proper decays;
2) As the main war industry, the USA can boost its domestic manufacturing sector by triggering wars outside its own borders by selling weapons etc.
Once the Americans start to lose bigger wars (which will happen soon, in the Ukraine; a little bit later, in Israel; and, in the more distant future, in the South China Sea) a “crisis of confidence” will quickly arise, collapsing both its military sector and its financial sector (both are closely interwined in capitalism, as I have explained in a previous comment here), which will inevitably affect the Dollar Standard.
Your comment is simply brilliant, and the fine and beautiful irony with which you explain it makes it even more understandable 👏👏👏👏
Enjoy your blog
POR LO QUE UD DR. MANIFIESTA DE USA, LE COMENTO QUE EN MI PAIS UN CANDIDATO PRESIDENCIAL ,QUIERE DOLARIZAR LA ECONOMIA….QUIERE DECIR QUE YO CIUDADANO DE UN PAIS CON SEÑORIO MONETARIO,TODAVIA, MALO PERO SEÑORIO AL FIN …MI MONEDA SIRVE PARA CONSUMIR PRODUCTOS,PAGAR, Y COMO RESERVA…..AL DOLARIZAR PASARIA A SER UN CIUDADANO DE USA DE SEGUNDA CLASE PERO TENDRIA LOS EFECTOS ADVERSOS DE VUESTRA INFLACION,FUTURA, DE VUESTROS DEFICIT FISCALES Y DE VUESTRAS GUERRAS , QUE ARRUINAN LA VIDA DE SUS CIUDADANOS CON VELEIDADES DE CONVOY…… QUE USA PAGUE SUS COSTOS Y QUE LOS ARGENTINOS COMAMOS GALLETA Y TOMEMOS MATE PERO TRANQUILOS ….MIS RESPETOS DR. HAAAAA HE INTERVENDRIAN VUESTROS TRIBUNALES EN NUESTROS PROBLEMAS….. SI EXISTE POR DIIIOOOOS DOCTOR MIS RESPETOS ________________________________
Michael thanks for pointing out that annualized is not annual which is why I removed my Facebook comment on your site. Nonetheless, the point I made in that comment stands. So turning to annual figures, NIPA Table 1.15 shows nominal GDP rose by 6.3% over the year. Table 1.16 showed real growth of 2.9% implying an inflation rate of 3.4% though Table 1.19 yields only 3.2%.
I have investigated over 20 large US corporation who have reported their Q3 earnings. This includes Exxon today, but I omit Amazon because it does not provide volume figures. The average price increase is around 6% but no corporation I have looked at, whether it is Procter & Gamble, or General Motors or Coca Cola have had volume growth year on year in the USA. (These price increases are not out of line with Adobe’s 5.3% average price increase for digital (e-commerce) sales during Q3. https://www.eseller365.com/adobe-digital-price-index-september-2023/#)
Contrary to the lack of volume growth or even falls by the major corporations, the annual US GDP volume or real GDP growth according to the BEA, is between 2.9% and 3.1%. Thus the discrepancy is at least 3%, and if we assume that if the largest corporations have a volume decline, this decline would be greater for the smaller corporations, it therefore permits a discrepancy of 4%. And this discrepancy remains even when allowing for the annual 1.5% addition from inventories and the trade balance (Table 1.12), Admittedly this reduces the discrepancy down to 2.5% which is within spitting distance of the growth rate of 2.9% recorded by the BEA itself, meaning that growth is cancelled out and at best the ‘resilient’ US economy has moved sideways. This is consistent with the tax data issued by the Congressional Budget Office. Once again it highlights the question of deflators. It was once said that the Chinese data was bad, but the US data is worse, distorted by deflated deflators and inflated adjustments.
As others have noted, the so-called excess savings has become interest payments on Treasury debt being distributed to wealthy households while households at the median and below have long exhausted the Covid years subsidies (extra unemployment benefits, child care assistance, checks, etc.) which were removed in 2022. Going mostly to 1% households, interest debt payments in 2023 are $2T and rising. So the Fed’s rate hike policy is not dampening Demand, it’s actually stimulating it (to the extent the rich actually spend their $2T windfall on real goods and services. Given their low consumption multiplier, they’re probably mostly reinvesting it in stock and other financial markets (including Treasuries to get more interest), both in US and abroad. Or else just hoarding it waiting for another boom in stock values when the recession deepens and the Fed has to lower rates. Capitalist monetary policies in the 21st century function mostly as conduits to the rich and capitalist investors; not as stabilization for the real economy. Ditto for fiscal policies. Latest example is Biden’s $1.65T subsidization of corporate America via his three bills in 2022: Infrastructure, Chip & Manufacturing, and Inflation Reduction–the latter which is a misnomer and should be entitled the Fossil Fuel Energy Subsidization bill. Both capitalist fiscal and monetary policy contradictions are intensifying since 2008
Jack your comment is well made.
It also explains why the rate of profit when measured by the net surplus versus pre-tax profits differs so markedly in terms of trend over the last 4 years. Net interest paid by the non-financial corporations has collapsed because of interest earned which has boosted pre-tax profits relative to the net surplus yielding a rate of profit that is relatively higher.
Hi Michael,
In the graph about the US credit card debt, what is the reason for the big upsurge in 2010. I guess it has do to with the “solutions” to the 2007-2008 financial crises.
I believe US manufacturing PMIs are also contracting now for several months
Jack – Yes. Indeed, nearly every economy’s manufacturing sector is in contraction. It’s a global manufacturing recession along with falling global trade..
Excellent analysis as usual. Just posted this piece: “Covid stimulus buoyed family finances, but gaps between well-off and low-wage households didn’t change much: Fed study. Meanwhile, U.S. national debt soared.” https://inequalityink.org/wp-content/uploads/2023/10/Fed-Survey-of-Consumer-Finances-2023-op-ed-latest.pdf
What is also interesting is how quickly the luxury goods market is contracting especially in the US. Seems the richer drinkers can no longer afford cognac. So maybe the rentier class is not so confident about the future.