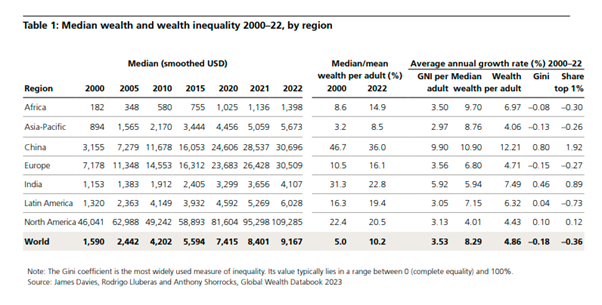
My last post was on the Global Wealth report produced every year by Credit Suisse and associated economists. It showed that in 2021, 1.2% of adults had 47.8% of the world’s wealth while 53.2% had just 1.1%.
However, as I published that post, the 2023 global wealth report was released, now under the name of UBS which has taken over Credit Suisse (that’s another story). Now the data show that in 2022, global wealth inequality dropped back to 1% of adults (59m) owning 44.5% of all personal wealth, still slightly higher than before the pandemic in 2019. At the other end of the wealth pyramid, the bottom 52.5% of the world’ population (2.8bn) had net wealth of just 1.2%, slightly better than in 2021.

2022 recorded the first fall in net global household wealth since the global financial crisis of 2008. One reason was an appreciation of the US dollar against other currencies, reducing the dollar wealth of non-dollar countries. Indeed, if exchange rates are held constant at 2021 rates, then total wealth increased by 3.4% and wealth per adult by 2.2% during 2022.
The other reason was the relative decline in financial wealth during 2022 as stock and bond markets prices fell. So the number of US dollar millionaires worldwide fell by 3.5 million during 2022 to total 59.4 million at year-end. The ultra-high net-worth (UHNW) group with wealth above USD 50 million had 22,490 fewer members than in 2021, with North America accounting for 81% of this decline.
But the long-term trends outlined in the post on the 2022 report remain. The vast majority of rich and very rich people still live in the so-called ‘Global North’. This century, the rise of household wealth in emerging markets, most notably in the large populations of China and India, has narrowed wealth differences between countries. And this has been the dominant factor governing the overall slightly downward global inequality trend.

China’s median wealth per person in 2000 was about twice the world average; now it is more than three times. Moreover, it is now higher than the average for the whole of Europe (that’s Western and Eastern Europe)!
And this point remains: If you own a property to live in and, after taking out any mortgage debt, you still have over $100,000 in equity and any savings, you are among the wealthiest 10% of all adults in the world. You may find that difficult to believe, but it’s true because most adults in the world have no wealth to speak of at all.
And apart from the phenomenal rise of China, personal wealth and power remains in the imperialist bloc of North America, Europe and Japan with add-ons from Australia. Just as the imperialist bloc rules over trade, GDP, finance and technology, it has nearly all the personal wealth.
I fish around in the Databook that accompanies the main report. Just now I found that between year 2000 and 2022 the total wealth of China has grown by 22 times, and the average for the world wealth total grew by almost 3 times. (page 117) The wealth for North America stalled between 2005 and 2010 due to the Great Recession, and since 2009 wealth doubled, shows the Global Wealth report. In contrast GDP per capita in the U.S. grew by 20% (Fed’s FRED graph). And average weekly earnings for 80% of workers, the nonsupervisory workers, went up by 10%, in constant 2012 dollars. The growth in wages is much slower than per capita GDP growth, and much slower than total wealth growth. As most know, the S&P 500 went up since 2009 by about 6 times. (from 700 to 4300). Wealth was $48 trillion in Jan. 2009, says the Fed’s Flow of Funds, and in early 2022 it was $150 trillion. Adjusting for inflation wealth still grew by 140%. I also look at RealTime Inequality, they have graphs for the distribution of income, and another for wealth.
The most up-to-date shows the lower 50% of US adults own an average of $8.4K, the group between 50% and 90% own $383K, the 90% to 98% own $2 M, the last 1% own $18M. Since 1976, the wealth share for the top 1% grew from 22% to 35%. The top 10% own 74%. It gets too loaded with numbers. With the income graph, not wealth, it shows that a shift of 15.4% of all income has favored the wealthiest 10% since 1976, 47 years. That means that $3.4 trillion that once was earned (15.4%) is now earned by the top 10%. This is a loss of income growth for the 90%, or if we had the same distribution ratio as 1976, each household in the lower 90% would earn $29,000 more each year.
Great stuff
The other facts that comes from the pyramid: the top 1.1% own on average $16.8 million, the next 12% average net worth is $193,753, the next 34.4% net worth averages $33,512, and the majority 52.5% average $1,935 per adult (this is all my calculation with $454 trillion being the sum of all world wealth). The last group owns between $1 and $10,000, meaning a good number own less than $500. This is a group portrait of a primitive group of humans. The median wealth per adult for the whole world is $8,654 (page 138). And that contradicts what I just said about $500. I believe they are wrong about $8,654, more like $865. On that page, 138, you see that Belgium wins the prize for most equally shared wealth, the median is pretty high, just under $250,000, and the average is over $350,000., and (page 144) the top 10% own just 43% of all wealth, compared to 73% in the U.S. Cell phones are very popular, no matter the wealth level. So are eskimo pies, I’m sure. An overview of wealth enables people to see the great potential that is unrealized.