The annual Credit Suisse report on global wealth has just been released. This report remains the most comprehensive and explanatory analysis of global wealth (not income) and inequality of wealth. Every year the CS global wealth report analyses the household wealth of 5.1 billion people across the globe. Household wealth is made up of the financial assets (stocks, bonds, cash, pension funds) and property (houses etc) owned. And the report measures this net of debt. The report’s authors are James Davies, Rodrigo Lluberas and Anthony Shorrocks. Professor Anthony Shorrocks was my university flatmate, where we both graduated in economics (although he has the much better mathematical skills!).
Global wealth grew during the past year by 2.6% to USD 360 trillion and wealth per adult reached a new record high of USD 70,850, 1.2% above the level of mid-2018 with Switzerland topping the biggest gains in wealth per adult this year. The US, China, and Europe contributed the most towards global wealth growth with USD 3.8 trillion, USD 1.9 trillion and USD 1.1 trillion respectively.
As in every year it has been published, the report reveals the extreme inequality of personal wealth globally. The bottom half of adults in the world accounted for less than 1% of total global wealth in mid-2019, while the richest decile (the top 10% of adults) possessed 82% of global wealth and the top percentile (1%) owned nearly half (45%) of all household assets. Wealth inequality is lower within individual countries: typical values would be 35% for the share of the top 1% and 65% for the share of the top 10%. But these levels are still much higher than the corresponding figures for income inequality, or any other broad-based welfare indicator.
While advances by emerging markets continued to narrow the gaps between countries, inequality within countries grew as economies recovered after the global financial crisis. As a result, the top 1% of wealth holders increased their share of world wealth. But this trend appears to have abated since 2016 and global inequality has edged downward slightly. Whereas the top 1% of wealth holders had 50% of the world’s personal wealth in 2016, up from 45% in 2006, that ratio has slipped back to 45%. Today, the share of the bottom 90% accounts for 18% of global wealth, compared to 11% in 2000.
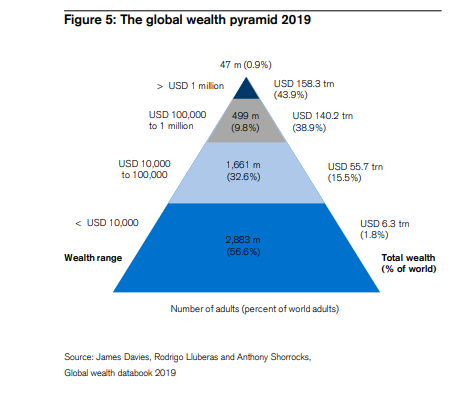
The wealth pyramid captures the wealth differences between adults. Nearly 3bn adults – 57% of all adults in the world – have wealth below USD 10,000 in 2019. The next segment, covering those with wealth in the range USD 10,000–100,000, has seen the biggest rise in numbers this century, trebling in size from 514 million in 2000 to 1.7 billion in mid-2019. This reflects the growing prosperity of emerging economies, especially China. The average wealth of this group is USD 33,530, still less than half the level of average wealth worldwide, but considerably above the average wealth of the countries in which most of the members reside. This leaves the final group of countries with wealth below USD 5,000, which are heavily concentrated in central Africa and central and south Asia.
So here’s the staggering thing. If you live in one of the advanced capitalist countries and you own your house and have some savings, then you will be among the top 10% of all wealth holders in the world. That’s because the vast majority of households in the world have little or no wealth at all.
A person needs net assets of just USD 7,087 to be among the wealthiest half of world citizens in mid-2019! However, USD 109,430 is required to be a member of the top 10% of global wealth holders and USD 936,430 to belong to the top 1%. African and Indian citizens are concentrated in the base segment of the wealth pyramid, China in the middle tiers, and North America and Europe in the top percentile. But also evident is a significant number of North American and European residents in the bottom global wealth decile, as younger adults acquire debt in advanced economies, resulting in negative net wealth.
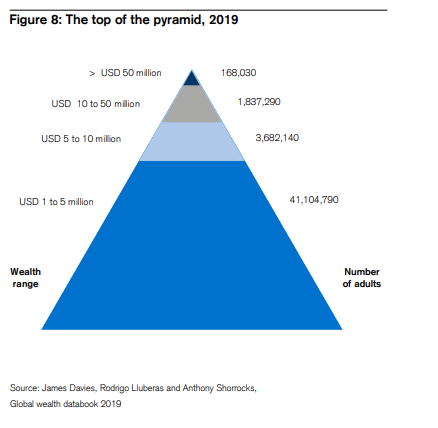
And inequality gets wider at the top of the pyramid. There are 46.8 million millionaires in the world in mid-2019, but most have wealth between USD 1 million and USD 5 million: 41.1 million or 88% of the millionaires. Another 3.7 million adults (7.9%) are worth between USD 5 million and 10 million, and almost exactly two million adults now have wealth above USD 10 million. Of these, 1.8 million have assets in the USD 10–50 million range, leaving 168,030 Ultra High Net Worth (UHNW) individuals with net worth above USD 50 million in mid-2019. In effect, these are the ruling elite of the world.
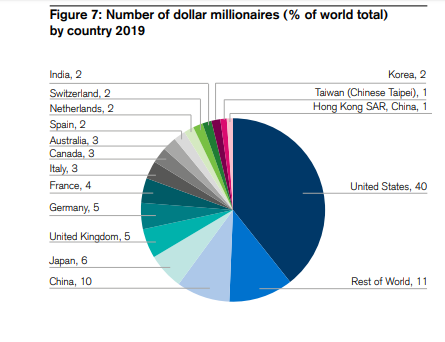
The United States has by far the greatest number of millionaires: 18.6 million, or 40% of the world total. For many years, Japan held second place in the millionaire rankings by a comfortable margin. However, Japan is now in third place with 6%, overtaken by China (10%). Next come the United Kingdom and Germany with 5% each, followed by France (4%), then Italy, Canada and Australia (3%).
Switzerland (USD 530,240), Australia (USD 411,060) and the United States (USD 403,970) again head the league table according to wealth per adult. The ranking by median average wealth per adult favours countries with lower levels of wealth inequality. This year, Australia (USD 191,450) edged ahead of Switzerland (USD 183,340) into first place. So Australia has the highest median wealth per adult in the world (that’s mainly house values).
Financial assets suffered most during the financial crisis of 2008-9 and then recovered in the early post-crisis years. This year, their value rose in every region, contributing 39% of the increase in gross wealth worldwide, and 71% of the rise in North America. However, non-financial assets (property) provided the main stimulus to overall growth in recent years. Over the 12 months to mid-2019, they grew faster than financial assets in every region. Non-financial wealth accounted for the bulk of new wealth in China, Europe and Latin America, and almost all new wealth in Africa and India. But household debt rose even faster, at 4.0% overall. Household debt increased in all regions, and at a double-digit rate in China and India. The debt squeeze is coming.

How come that at the same time, inequality is rising and the rate of profit is declining? Is it not that higher inequality means that more and more of the produced value is expropriated in the form of surplus value?
Inequality of income depends on many factors, not just profits from production. There is income from capital and fictitious capital. Inequality of incomes also depends on inequality in wages. Also inequality of income is a ratio between two incomes or an average of incomes (gini). Surplus value from production can be rising and even the rate of surplus value can rise but the rate of profit can still be falling (Marx’s law). So rising inequality can happen alongside a fall in profitability. For more on this, see my posts. https://thenextrecession.wordpress.com/2018/04/11/inequality-and-exploitation/ https://thenextrecession.wordpress.com/2014/03/11/is-inequality-the-cause-of-capitalist-crises/
Michael these pyramids represent global inequalities in personal wealth. Though unintentionally, they very graphically demonstrate the fact that much (if not most) of the personal and corporate wealth accumulated in the imperial west (via laundered global commodity chains) is produced by super-exploited workers in the peripheries who own nothing themselves. Why not point this out? Especially since these imperial chickens have come home to roost on the austerity-addled heads wage earners in its privileged centers?
Martha I have discussed whether ‘super-exploitation’ is at the basis of modern imperialism or not in some previous posts. See here. Shortly, Guglielmo Carchedi and I will publish a long paper on the economic foundations of imperialism. https://thenextrecession.wordpress.com/2016/03/13/thoughts-on-the-debate-on-imperialism/
Thanks for the link. I’ve re-read the post and still think it is an excellent discussion of the ambiguities of center/periphery/super-exploitation theories, but stops somewhere between marxist theorists like John Smith (on the left) and David Harvey (on a trip). I’m looking forward to your next book.
Yes, somewhere in between. Carchedi and I plan to flesh out the theory and empirical evidence on imperialism. We shall be presenting our results in a session at the Historical Materialism conference in London in Sunday 10 November along with John Smith and other experts on the issue. Details on the Michael Roberts blog Facebook site.
Very interesting and relevant. However, I wonder how you handle access to benefits that are not sold and therefore has no market value. Cooperative housing f.ex. I have a cheap monthly rent, but the memberships is only 100 usd worth. Or being a Chinese citizen with a 1.3 billion share of the states fortune. For not to speak about what could be the market value of a Kuwait citizenship. What about the Cubans that may own nothing but have assured free eduaction and health of high quality. As I see it, government meassures to reduce unequity may often reduce the fortune of the poorest.
I don’t quite understand, Roberts:
When wealth is calculated, is financial debt not taken into account?
The CS data take debt off total wealth and generate net wealth. So yes it is.
I cant see my comment. what happened?!
Every comment must be approved by me to stop lunatics and bad language and any other unacceptable remarks. But sometimes I go to sleep or go out and so cannot deal with all comments immediately
The average for all 5.1 bn adults is 10 times the median — $70,849 vs $7,087. The average wealth for the lower 57% (2.883 bn adults) with less than $10,000 is $2,185. (page 162, Databook) I wonder what that median is for the lower half. Maybe $2,000, maybe $1,000. Wealth is not like normal currency: in the U.S. the household net worth was $48 trillion in Jan. 2009, and $108 trillion in 2019, an increase of $60 trillion. The nation did not save $60 trillion of income. The savings rate was around 5% of a total income of (say 10 times the average national income of $14 trillion = $140 X 5% = 7 trillion.) Where did the extra $53 trillion come from? Wealth is a finite number of financial assets and also “tangible” assets like real estate, but 70% financial. The value explodes when the extraction of the richest pours their left-over income into the finite market of financial assets, and they inflate in value. I think of it as a dual currency system. The wealth to GDP ratio is now 5 to 1, and 3.5 to 1 is the 1940 to 1980 norm. World wide this explosion also must be going on, Credit Suisse reports in 2000 Global Wealth Report, 2018, page 14: “Measured in current US dollars, total global wealth rose from USD 117 trillion in 2000 to 317 trillion in mid-2018, a rise of USD 200 trillion, equivalent to roughly 2.5 times global GDP.” In 18 years world wealth more than doubles, an increase of 171%. Financial values are not a normal market sort of value, supply and demand. The supply is always limited to profit making enterprises, and they stay limited. The demand explodes. This is why a tax on wealth is needed, a tax beginning says Pikkety at $32 million, but I’m not sure on that. I’d say begin it, who cares where, just begin it now. The U.S. gains $60 trillion in 10 years, and the federal government spent $41 trillion, and subtract Social Security which is a transfer more than a tax, and the Fed spends $31 trillion. Time to pay for everything with a wealth tax. That should prove very popular.
May I have the reference of the report
BR
Ghada – It was in the post. https://www.credit-suisse.com/about-us/en/reports-research/global-wealth-report.html
Wealth is determined by the value of assets. To my thinking, value is based upon two fundamentals: need and want. So just how do we redistribute personal wealth to aid the needy? Converting wealth which is based on a value determined by “want” would seem to be rather difficult. For example, if my wealth is determined by the “want” value of my rare art work holdings, how is this wealth used to satisfy the basic needs of the poor? Unless we can convert “want ” value to “need” value without destroying the basis for wealth, is there really any use in discussing wealth inequality.
Michael, I would like to hear your thoughts on the *effect* of this imbalance in individual wealth. Perhaps you have done so already. As I understand it, the problem is not so much the concentration of wealth per se as it is the concentration of the power to decide what to do with that wealth, what to invest it in. After all, it isn’t as if vast quantities of wealth are stuffed into mattresses gathering dust, the money is in play somewhere, the question is where. Yes? No? Almost? 🙂
“African and Indian citizens are concentrated in the base segment of the wealth pyramid…”
That’s not exactly true.
Look here:
https://marx-forum.de/Forum/gallery/index.php?image/1088-distribution-of-wealth-in-india/
Wal Buchenberg, Hannover
Very good article, the kind that could be used in the elections. If you have no contacts in the Labour Party let me know. In the UK tax dodging has averaged £100 billion p.a. since 2010 (PCS) union while cuts have averaged £40 billion (IFS). The balance of £60 billion p.a. or £600 billion in total enough to build more than a million homes, fully fund the NHS and social services. When we were outside the job centre we used the example of 1p, 10p and £1. 1p represented DWP fraud (1.2 billion) 10p represented unclaimed benefits (14 billion) and £1 in tax dodging (£120 billion)