Last week, the OECD published its latest World Economic Outlook. WARNING GRAPHICS OVERLOAD AHEAD!
The OECD’s economists reckon that “The global economy is now growing at its fastest pace since 2010, with the upturn becoming increasingly synchronised across countries. This long-awaited lift to global growth, supported by policy stimulus, is being accompanied by solid employment gains, a moderate upturn in investment and a pick-up in trade growth.”
While world economic growth is accelerating a bit, the OECD reckons that “on a per capita basis, growth will fall short of pre-crisis norms in the majority of OECD and non-OECD economies.” So the world economy is still not yet out of the Long Depression that started in 2009.
The OECD went on: “Whilst the near-term cyclical improvement is welcome, it remains modest compared with the standards of past recoveries. Moreover, the prospects for continuing the global growth up-tick through 2019 and securing the foundations for higher potential output and more resilient and inclusive growth do not yet appear to be in place. The lingering effects of prolonged sub-par growth after the financial crisis are still present in investment, trade, productivity and wage developments. Some improvement is projected in 2018 and 2019, with firms making new investments to upgrade their capital stock, but this will not suffice to fully offset past shortfalls, and thus productivity gains will remain limited.”
The OECD also thinks that much of the recent pick-up is fictitious, being centred on financial assets and property. “Financial risks are also rising in advanced economies, with the extended period of low interest rates encouraging greater risk-taking and further increases in asset valuations, including in housing markets. Productive investments that would generate the wherewithal to repay the associated financial obligations (as well as make good on other commitments to citizens) appear insufficient.” Indeed, on average, investment spending in 2018-19 is projected to be around 15% below the level required to ensure the productive net capital stock rises at the same average annual pace as over 1990-2007.
The OECD concludes that, while global economic growth will be faster in 2017 and 2018, this will be the peak. After that, world economic growth will fade and stay well below the pre-Great Recession average. That’s because global productivity growth (output per person employed) remains low and the growth in employment is set to peak. That’s a ‘slow burn’ of slowing economic growth.
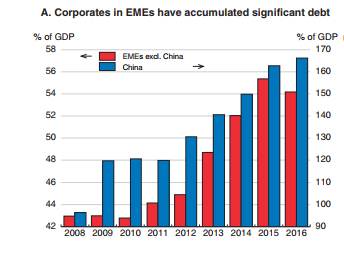
But even more worrying for global capitalism is the prospect of a new economic slump, now that we are some nine years since the last one. In a chapter of the World Economic Outlook, the OECD’s economists raise the issue of the very high levels of debt (both private and public sector) that linger on since 2009. “Despite some deleveraging in recent years, the indebtedness of households and nonfinancial businesses remains at historically high levels in many countries, and continues to increase in some.” The debt of non-financial firms (NFC) rose relative to GDP during the mid-2000s, generally peaking at the onset of the global financial crisis and remaining stable thereafter.

After a limited downward adjustment during the post-crisis period, NFC debt-to-GDP ratios have increased again since.

Household debt-to-income ratios also rose significantly up to 2007 and stabilised thereafter at historically high levels in most advanced economies. The rise in the debt-to-income ratio was driven by the acceleration in debt accumulation prior to the crisis, with subdued household income growth impeding deleveraging thereafter.

And as I have reported before in previous posts, non-financial companies (NFC) in the so-called emerging economies have sharply increased their debt burdens over the last nine years, so that now, ‘rolling over’ this debt as it matures for repayment amounts to about half of the gross issuance of international debt securities in 2016. In other words, debt is being issued to repay earlier debt at an increasing rate.
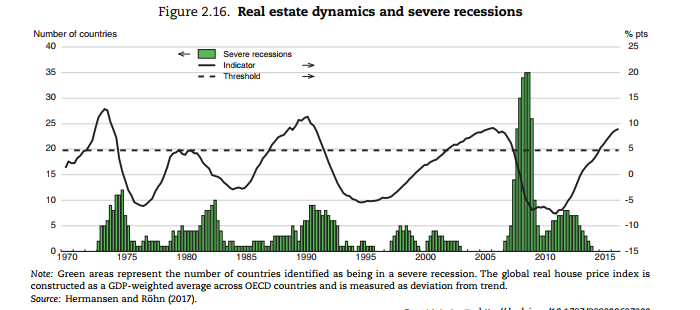
The OECD points out that there is empirical evidence that high indebtedness increases the risk of severe recessions. Also, if the prices of ‘fictitious’ assets like property or stocks get well out of line with the value of productive assets (ie capital investment), that is another indicator of a coming recession. Currently, there is no OECD economy in recession (defined as two consecutive quarters of a fall in GDP), but the global house price index is reaching a peak level over the trend average that has signalled recessions in the past.
Credit is necessary to capitalism to overcome the ‘lumpiness’ in capital investment and smooth over cash liquidity. But as Marx argued, ‘excessive’ credit expansion is a sign that the profitability of productive investment is falling. As the OECD puts it: “If borrowing is well used, higher indebtedness contributes to economic growth by raising productive capacity or augmenting productivity. However, in many advanced economies, the post-crisis build-up of corporate debt has not translated into a rise in corporate capital expenditure.”
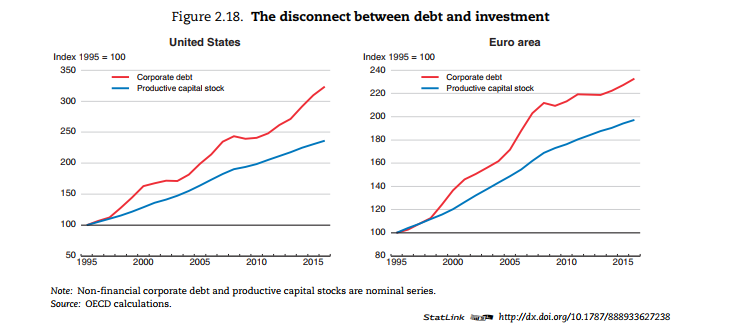
So the OECD concludes that the post-crisis combination of rising corporate debt and historically high share buybacks may suggest that, rather than financing investment, firms took on debt to return funds to shareholders. This reflects “pessimism about future demand and economic growth, leading corporations to defer capital spending and return cash to their shareholders for want of attractive investment opportunities.” Moreover, firms with a persistently high level of indebtedness and low profits can become chronically unable to grow and become “zombie” firms. And zombie “congestion” may thus reduce potential output growth by hampering the productivity-enhancing reallocation of resources towards more dynamic higher productivity firms.
So the OECD story is that world economic growth is picking up and there is little sign of any slump in production in the immediate future, even if growth may stay well below the pre-crisis average. But there are risks ahead because the still very high levels of debt and speculation in financial assets that could come a cropper if profitability and growth should falter.
This is much the same story that the IMF told in latest IMF report on Global Financial Stability that I referred to in a recent post. As the IMF put it: “Private sector debt service burdens have increased in several major economies as leverage has risen, despite declining borrowing costs. Debt servicing pressure could mount further if leverage continues to grow and could lead to greater credit risk in the financial system.”
The IMF comments: “While debt accumulation is not necessarily a problem, one lesson from the global financial crisis is that excessive debt that creates debt servicing problems can lead to financial strains. Another lesson is that gross liabilities matter. In a period of stress, it is unlikely that the whole stock of financial assets can be sold at current market values— and some assets may be unsellable in illiquid conditions.” So “if there are adverse shocks, a feedback loop could develop, which would tighten financial conditions and increase the probability of default, as happened during the global financial crisis.”
The IMF sums up the risk. “A continuing build-up in debt loads and overstretched asset valuations could have global economic repercussions. … a repricing of risks could lead to a rise in credit spreads and a fall in capital market and housing prices, derailing the economic recovery and undermining financial stability.”
The IMF posed an even nastier scenario for the world economy than the OECD by 2020. Yes, the current ‘boom’ phase can carry on. Equity and housing prices can continue to climb. But this leads to investors to drift beyond their traditional risk limits as the search for yield intensifies despite increases in policy rates by central banks. Then there is a ‘Minsky moment’.
There is a bust, with declines of up to 15 and 9 percent in stock market and house prices, respectively, starting at the beginning of 2020. Interest rates rise and debt servicing pressures are revealed as high debt-to-income ratios make borrowers more vulnerable to shocks. “Underlying vulnerabilities are exposed and the global recovery is interrupted.” The IMF estimates that the global economy could have a slump equivalent to about one-third as severe as the global financial crisis of 2008-9 with global output falling by 1.7 percent from 2020 to 2022, relative to trend growth.
Will the high debt in the corporate sector globally eventually bring down the house of cards that is built on fictitious capital and engender a new global slump? When is credit excessive and financial asset prices a bubble?
The key for me, as readers of this blog know, is what is happening to the profitability of capital in the major economies. If profitability is rising, then corporate investment and economic growth will follow – but also vice versa. But if profitability and profits are falling, debt accumulated will become a major burden. Eventually the zombies will start to go bankrupt, spreading across sectors and a slump will ensue. Financial prices will quickly collapse toward the real value of their underlying productive assets.
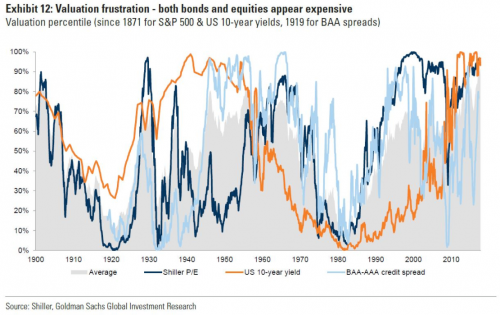
Indeed, according to Goldman Sachs economists, the prices of financial assets (bonds and stocks) are currently at their highest against actual earnings since 1900!
What the OECD and IMF reports show is that if there is a downturn in profitability, the next slump will be severe, given that private debt (both corporate and household) has not been ‘deleveraged’ in the last nine years – indeed on the contrary. As I said, in my paper on debt back in 2012: “Capitalism is now left with a huge debt burden in both the private and public sector that will take years to deleverage in order to restore profitability. So, contrary to the some of the conclusions of mainstream economics, debt (particularly private sector debt) does matter.”
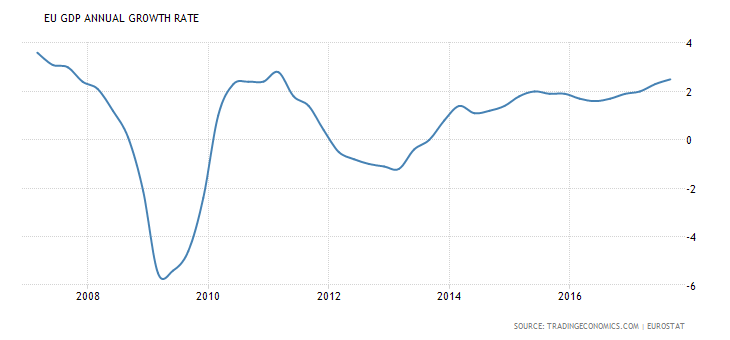
For now, the world economy is making a modest recovery from the stagnation that appeared to be setting in from the end of 2014 to mid-2016. The Eurozone economic area is seeing an acceleration of growth to its highest rate since the end of the Great Recession.
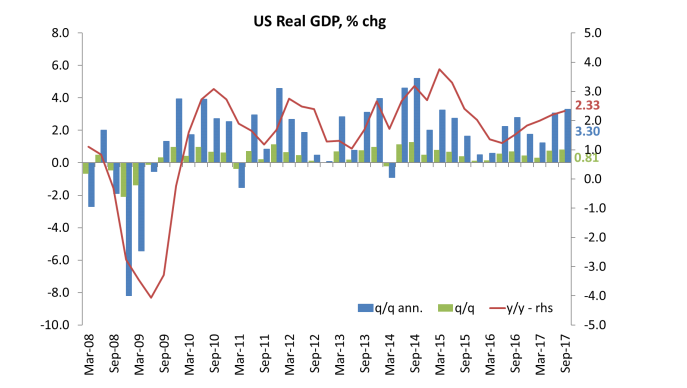
Japan too is picking up, based on a weak currency that is enabling exports to be sold. And the latest figures for the US show an annualised rise of 3.3% in third quarter of 2017, putting year on year growth at 2.3%, still below the rates achieved in 2014 but much better than in 2016 (1.6%). And the forecast for this current quarter is for similar.
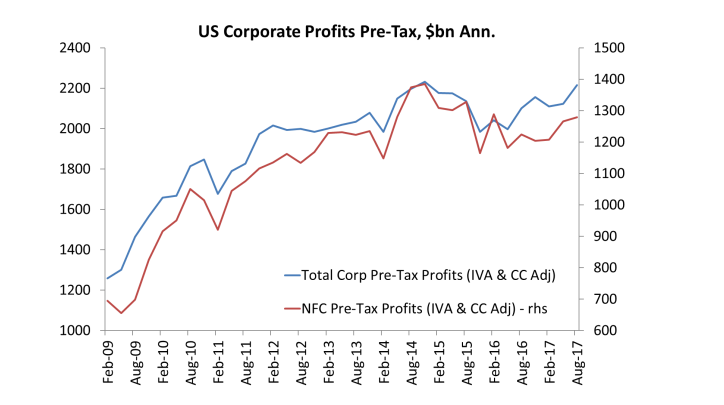
As for corporate profits and investment, the latest data show that US corporate profits were rising at over 5-7% yoy before tax, although stripping out the mainly fictitious profits of the financial sector reveals that the mass of profit is still well below the peak of end-2014.
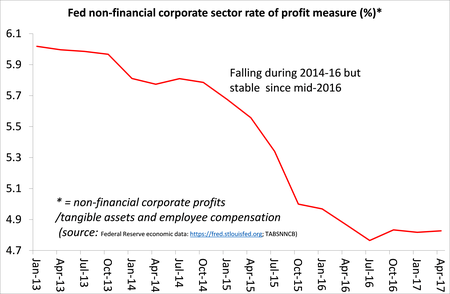
And as I showed in a recent post, profitability has fallen since 2014.
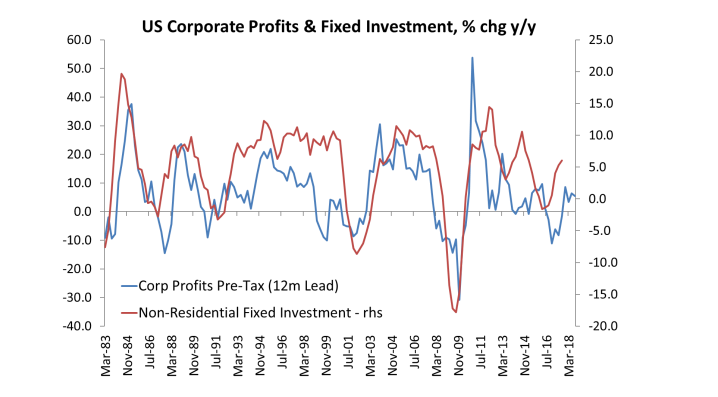
There is a high correlation and causality between the movement of profits and productive investment.
And that is confirmed in the latest data for the US. As corporate profits have recovered from the slump of 2015-16, so business investment has made a modest improvement.
As for global corporate profits, we don’t have all the data for Q3 2017, but it looks as though it will continue to be on the up.

So overall, global economic growth has improved in 2017 and, so far, looks likely to do so in 2018 too. Corporate profits are rising and that should help corporate investment. But profitability of capital remains weak and near post-war lows and corporate debt has never been higher.
Any sharp upswing in interest rate costs (and the US Fed continues to hike) will increase the debt servicing burden. So if corporate profits should peak and falter in the next year or so, a major recession will be on the agenda.

Does it matter that debt to income ratios for households are at historically high levels ? Isn’t the level of debt service costs to income a better indicator of financial fragility ? (As argued here, for example, https://tinyurl.com/ycfutswl ).
Similarly, with public debt, the Tories and others point to a historically high level of debt to GDP, while in fact debt service costs are historically extremely low, which suggests government debt is not a problem at all at present.
I’m not sure, but I think Japan has public debt / income ratio of around 230%, yet debt service costs are less than 2% of GDP.
Tony – yes, you are right, debt servicing costs are generally low because interest rates are low. That’s why companies, households and governments are taking on more debt with equanimity. Central banks have driven interest rates down to near zero with quantitative easing. But the point is that debt levels have risen so if the cost of capital were to start to rise and/or profitability were to fall, then debt servicing costs could jump (as they did prior to 2008). And central banks are now starting to reverse their easy money policies because they think everything is fine now.
Are US profits really on the rise? This article suggests: “Corporate Profits, the driver of wage growth and employment growth, may start to decelerate over the next couple of quarters.” https://seekingalpha.com/article/4128882-pay-25-percent-5-percent-less?auth_param=1el4h8:1d21ql5:206878bd41ba9b131ff2915909395e10&uprof=45&dr=1
The article makes two good points, one of which I also made. The first is that NFC profits are still lower than in 2014 (I said “stripping out the mainly fictitious profits of the financial sector reveals that the mass of profit is still well below the peak of end-2014.”. The second is that the year on year comparison in 2018 is likely to show profits slowing because the higher figures for 2017 will be difficult to beat at the same rate. I did a quick calc and reckon that US NFC profits must continue to rise at 7% yoy thru to mid 2018 to regain the peak achieved in mid-2014. That wont be easy and even if achieved would still mean four years of flat profits
But remember this is only the US – my calculation for global profits is still trending up (although in China and Japan profit growth is now slowing). But the US remains the most important economy to indicate future global growth, so we’ll see.
Michael. Great post.
It reminds me of the conversation I had with Dick Fuld (then head of Lehman Bros) during a press conference in the spring of 2007. We agreed we’d never seen so many positive economic forecasts (from everyone from the IMF to Moody’s etc. There were no exceptions).
He was asked that if there was a risk of a crash, where might it reside? US mortgage debt?
He said no, terrorism. It was laughable.
There were two conclusions:
1 He and other heads of major financial institutions plus every economist on the planet had no idea what was going on (this is less than 18 months before Lehman Bros collapsed) or
2 They did, but didn’t want to admit it openly.
There’s a whiff of all that in the OECD report.
The truth is that practically everyone with influence has a vested interest in keeping the party going for as long as possible. In 2007, this was to allow banks and others to sell toxic CDOs etc to the even more clueless.
It’s probably a bit of both.
Practically all assets held by investors are intangible. They are figments of imaginations and are unquantifiable. They can only stay at present levels because people believe they will stay at or above present levels.
The moment faith is lost is when the asset value slump will come.
Not sure science can help, any more.
It looks like the US 10 year yield follow a clear long wave pattern. Why?
The EU is growing at the fastest pace since 2000. The last US GDP was revised up to 3.3%. It looks like that “next recession” fortunately has been pushed further into the distance, and maybe either a falling rate of profits wasn’t an obstacle to further investment in circulating capital, (witnessed by the continued growth of employment), or else the measurement of the rate of profit is wrong, or more likely both.
“Central banks have driven interest rates down to near zero with quantitative easing.”
Not according to Marx and Marx’s theory they haven’t. Marx says the rate of interest is the market price of money-capital, determined by the interaction of its supply and demand. He would have been horrified to think that anyone basing themselves on his theory, in fact, was putting forward the argument of his opponent Lord Overstone, in such a question, who confused money-capital with money, and liquidity, and confused an increase in the supply of money-capital with an increase in the supply of liquidity.
Marx is at pains in Capital III, to show the fallaciousness of the argument that interest rates can be reduced by increasing the supply of money, as opposed to increasing the supply of loanable money-capital. All that increasing liquidity can do, marx says, is to increase inflation. By increasing inflation, it simply changes the price labels on each side of the equation of the demand and supply of money-capital.
On one side, nominally more money-capital is made available – because the value of the money itself has been depreciated – but on the other side of this equation, the nominal demand for money-capital also rises, because the prices of those commodities that comprise the capital have been inflated, i.e. the price of labour-power rises, the prices of materials rises, the price of machines rises, and consequently, a greater nominal sum of money-capital is required to make these purchases. So, although printing money may devalue the currency so that instead of £100 million of money-capital being demanded and supplied at an equilibrium rate of 6%, the devalued currency and inflation simply results in £200 million of money-capital being demanded and supplied, at an equilibrium rate of 6%.
As Marx says in Theories of Surplus Value, Chapter 7,
“Hume attacks Locke, Massie attacks both Petty and Locke, both of whom still held the view that the level of interest depends on the quantity of money, and that in fact the real object of the loan is money (not capital).
Massie laid down more categorically than did Hume, that interest is merely a part of profit. Hume is mainly concerned to show that the value of money makes no difference to the rate of interest, since, given the proportion between interest and money-capital—6 per cent for example, that is, £6, rises or falls in value at the same time as the value of the £100 (and. therefore, of one pound sterling) rises or falls, but the proportion 6 is not affected by this.”
The only thing that QE could do was to inflate the prices of those classes of bonds that the central bank bought, and also the prices of other financial assets into which such funds were speculated. But, by draining money-capital into these privileged assets, it thereby drains money-capital from elsewhere, for example the supply of loans to small and medium sized businesses, which as you yourself showed some time ago, accounted for only about 4% of UK Bank lending, and the cost of which is far higher (around 10% for peer to peer lenders, where such loans are available, and much higher where businesses are forced back on personal financing) than the yields on Gilts, or top rated corporate bonds, not to mention the exorbitant cost of borrowing for consumers, with credit card rates at 20-30%, and Payday loan rates at up to 4000% p.a.
I should add the point that Marx makes in regard to this latter form of borrowing that it does not matter here that what the consumer, or small business demands might be money, rather than money-capital, what the lender lends is money-capital, i.e. the use value of capital to produce the average rate of profit, and they are not bothered to what purpose the borrower seeks to put it. As Marx points out, it is in fact in conditions where borrowers are more desperate to borrow, to stay afloat, that the suppliers of money-capital know they can charge the highest rates of interest.
With money sucked into privileged assets backed by central banks, the supply of money-capital for these latter types of borrowers is constrained more, and their desperation to borrow that much more heightened, which is why the market rates of interest have been driven up.
The continuous fall in global interest rates from the 1980’s, until recently had nothing to do with QE or low official interest rates – indeed in the mid 1980’s, Volcker raised official interest rates sharply and constrained money supply, but market rates of interest fell. The reason as marx describes in such conditions is that as the rate of profit rose, firms could finance their accumulation more from internal resources, and what they didn’t use was thrown into money markets. The rise in productivity also reduced the value of those commodities that comprise capital, thereby reducing the demand for money-capital relatively. A rising rate of profit, with falling commodity values, meant that the supply of money-capital relative to the demand for money-capital intensified, driving down the rate of interest, which in turn drove up asset prices, based on capitalised revenue.
“indeed in the mid 1980’s, Volcker raised official interest rates sharply and constrained money supply, but market rates of interest fell. The reason as marx describes in such conditions is that as the rate of profit rose, firms could finance their accumulation more from internal resources, and what they didn’t use was thrown into money markets.”
Uhh……no, as usual Boffy theorizing is unconstrained, but refuted, by the reality.
The US prime rate in 1981 was 20 percent. By January 1990, it had fallen to 10.5 percent. However, corporations did not experience some magical increase in the rate of profit that allowed them to “finance their accumulation more from internal resources.” Debt liabilities for non-financial corporations in the US effectively tripled during that period and the debt liabilities as a percentage of value of non-financial businesses went from approximately 59 percent to 81 percent.
And I should add, that market rates didn’t fall because Volcker raised the official rate, but because of the ensuing double dip recession, the most severe (at that time) since WW 2.
Well researched and well balanced article and like you I agree that Exhibit 12 (graph) says it all. Boffy is essentially correct in his reading of Marx. Share buy backs for instance, at an average of $400 billion annually (U.S.A.), over two decades has dwarfed the amount Central Banks have fed the markets through QE. The posting is correct to project it will take up to 2018, at current trends, for real profits to equal 2014. The question is how durable is the current trend. My recent posting on turnovers for Q2, which shows a deceleration, suggests this trend will not be sustained. For example, Domestic Industries, non-financial corporate profits only increased by 1% in quarter three compared to quarter two. Here is the article – https://theplanningmotivedotcom.files.wordpress.com/2017/12/q2-us-economic-report-pdf.pdf
I think we need to keep in mind exactly what QE was intended to do, and that was to reduce the risk of systemic collapse– to eliminate not a liquidity crisis, which is what Boffy, if I recall correctly, calls 2008-2009, but rather a solvency crisis.
In that regard QE has to be regarded as part of the overall program of governments taking capital positions in banks, making debt holders whole, saving the system as a system, something well beyond the impact, and ability of share buybacks.
Before the recession the Fed held app $700 billion of securities on its balance sheet– in US Treasury instruments. The securities purchased by the Fed during its 3 episodes exceeded $2 trillion in face value, when allowing for debt that matured during those phases. .
Phase 1 opened in Nov 2008 with authorization to purchase 600 billion in mortgage backed securities. This was expanded and by March 2009 the Fed held $1.75 trillion in MBS, bank debt, and US sovereign debt instruments.
QE 2 in November 2010 authorized $600 billion more in purchases
QE3 announced in September 2012 was an open-ended (no end date)program initially at 40 billion/month, but was increased to $85 billion a month. A “taper” was announced in June 2013, with purchases reduce to $65 billion per month.
Anyway at the end of 2013, beginning of 2014, the Fed balance sheet held $2 trillion in treasury instruments and 1.2 trillion in MBS.
And we haven’t even begun to consider the Bank of Japan’s QE, that stretches over a far greater time period; or the Bank of England’s; of the ECB’s.
Did any of this QE “restore” the capitalist economy? No. But it did reduce the risk of systemic collapse, allowing the bourgeoisie to shift the entire burden of recession onto workers.
Asking if profit is fundamental to capitalism is a bit like asking if the Pope is Catholic. But it still puzzles me a bit that all the focus is on profit. After all, profit is the surplus product produced by the working class, so profit isn’t going anywhere anytime soon.
For me the greater focus should be on extending markets, because if capitalism cannot extend markets it is finished. Short of finding intelligent life on Mars, life that has both intelligence and a capacity to be freely enslaved (which seems like a long shot to me), then the internet feels like the last stop in the technological journey of capitalism, because internet provides the perfect tool to make the whole planet an integrated market. Of course much more is required, for example huge infrastructure developments. China are still consuming concrete like it has gone out of fashion.
There is a logical basis for catastrophism but it isn’t profit but market expansion. I believe we are entering a very unstable and rocky period precisely because we are entering the final lap of market extension, and that has 2 outcomes, either a communist like system or massive destruction of physical property and values. If you only have massive destruction of values then you still have the market expansion problem, a massive destruction of property is one way of dealing with this problem!