Revised figures for growth in the US economy in the second quarter of this year were released yesterday. Most analysts were pleased as the rise in real GDP in Q2 2-14, was revised up from a 4.0% annualised rate to 4.2%. The drop in real GDP for the first quarter of this year was confirmed at -2.1%. When compared to the prior quarter, the new measurement is up about 6.3% pts from the -2.1% contraction rate for the 1st quarter of 2014. This is the largest positive quarter to quarter improvement in GDP growth in 14 years.
The reason for the slight rise in the revised figure was that business investment (i.e. investment by companies in new equipment, offices and technology as opposed to residential investment by household buying houses) was revised up from 5.5% to a 8.4% annual rate of growth. At the same time, the first figures for corporate profits in the second quarter were announced. Profits rose $155bn compared with a drop in profits of $202bn in the first quarter of this year.
So it would appear that the US economy is now growing quite strongly and the terrible first quarter was really just due to a ‘bad winter’ as was argued by the mainstream at the time. But looking at quarterly rates of growth (annualised) may be useful to show how an economy is doing from one quarter to the next. But it does not show the trend of activity. For that, it is better to compare year-on-year growth. And here the story is less exciting.
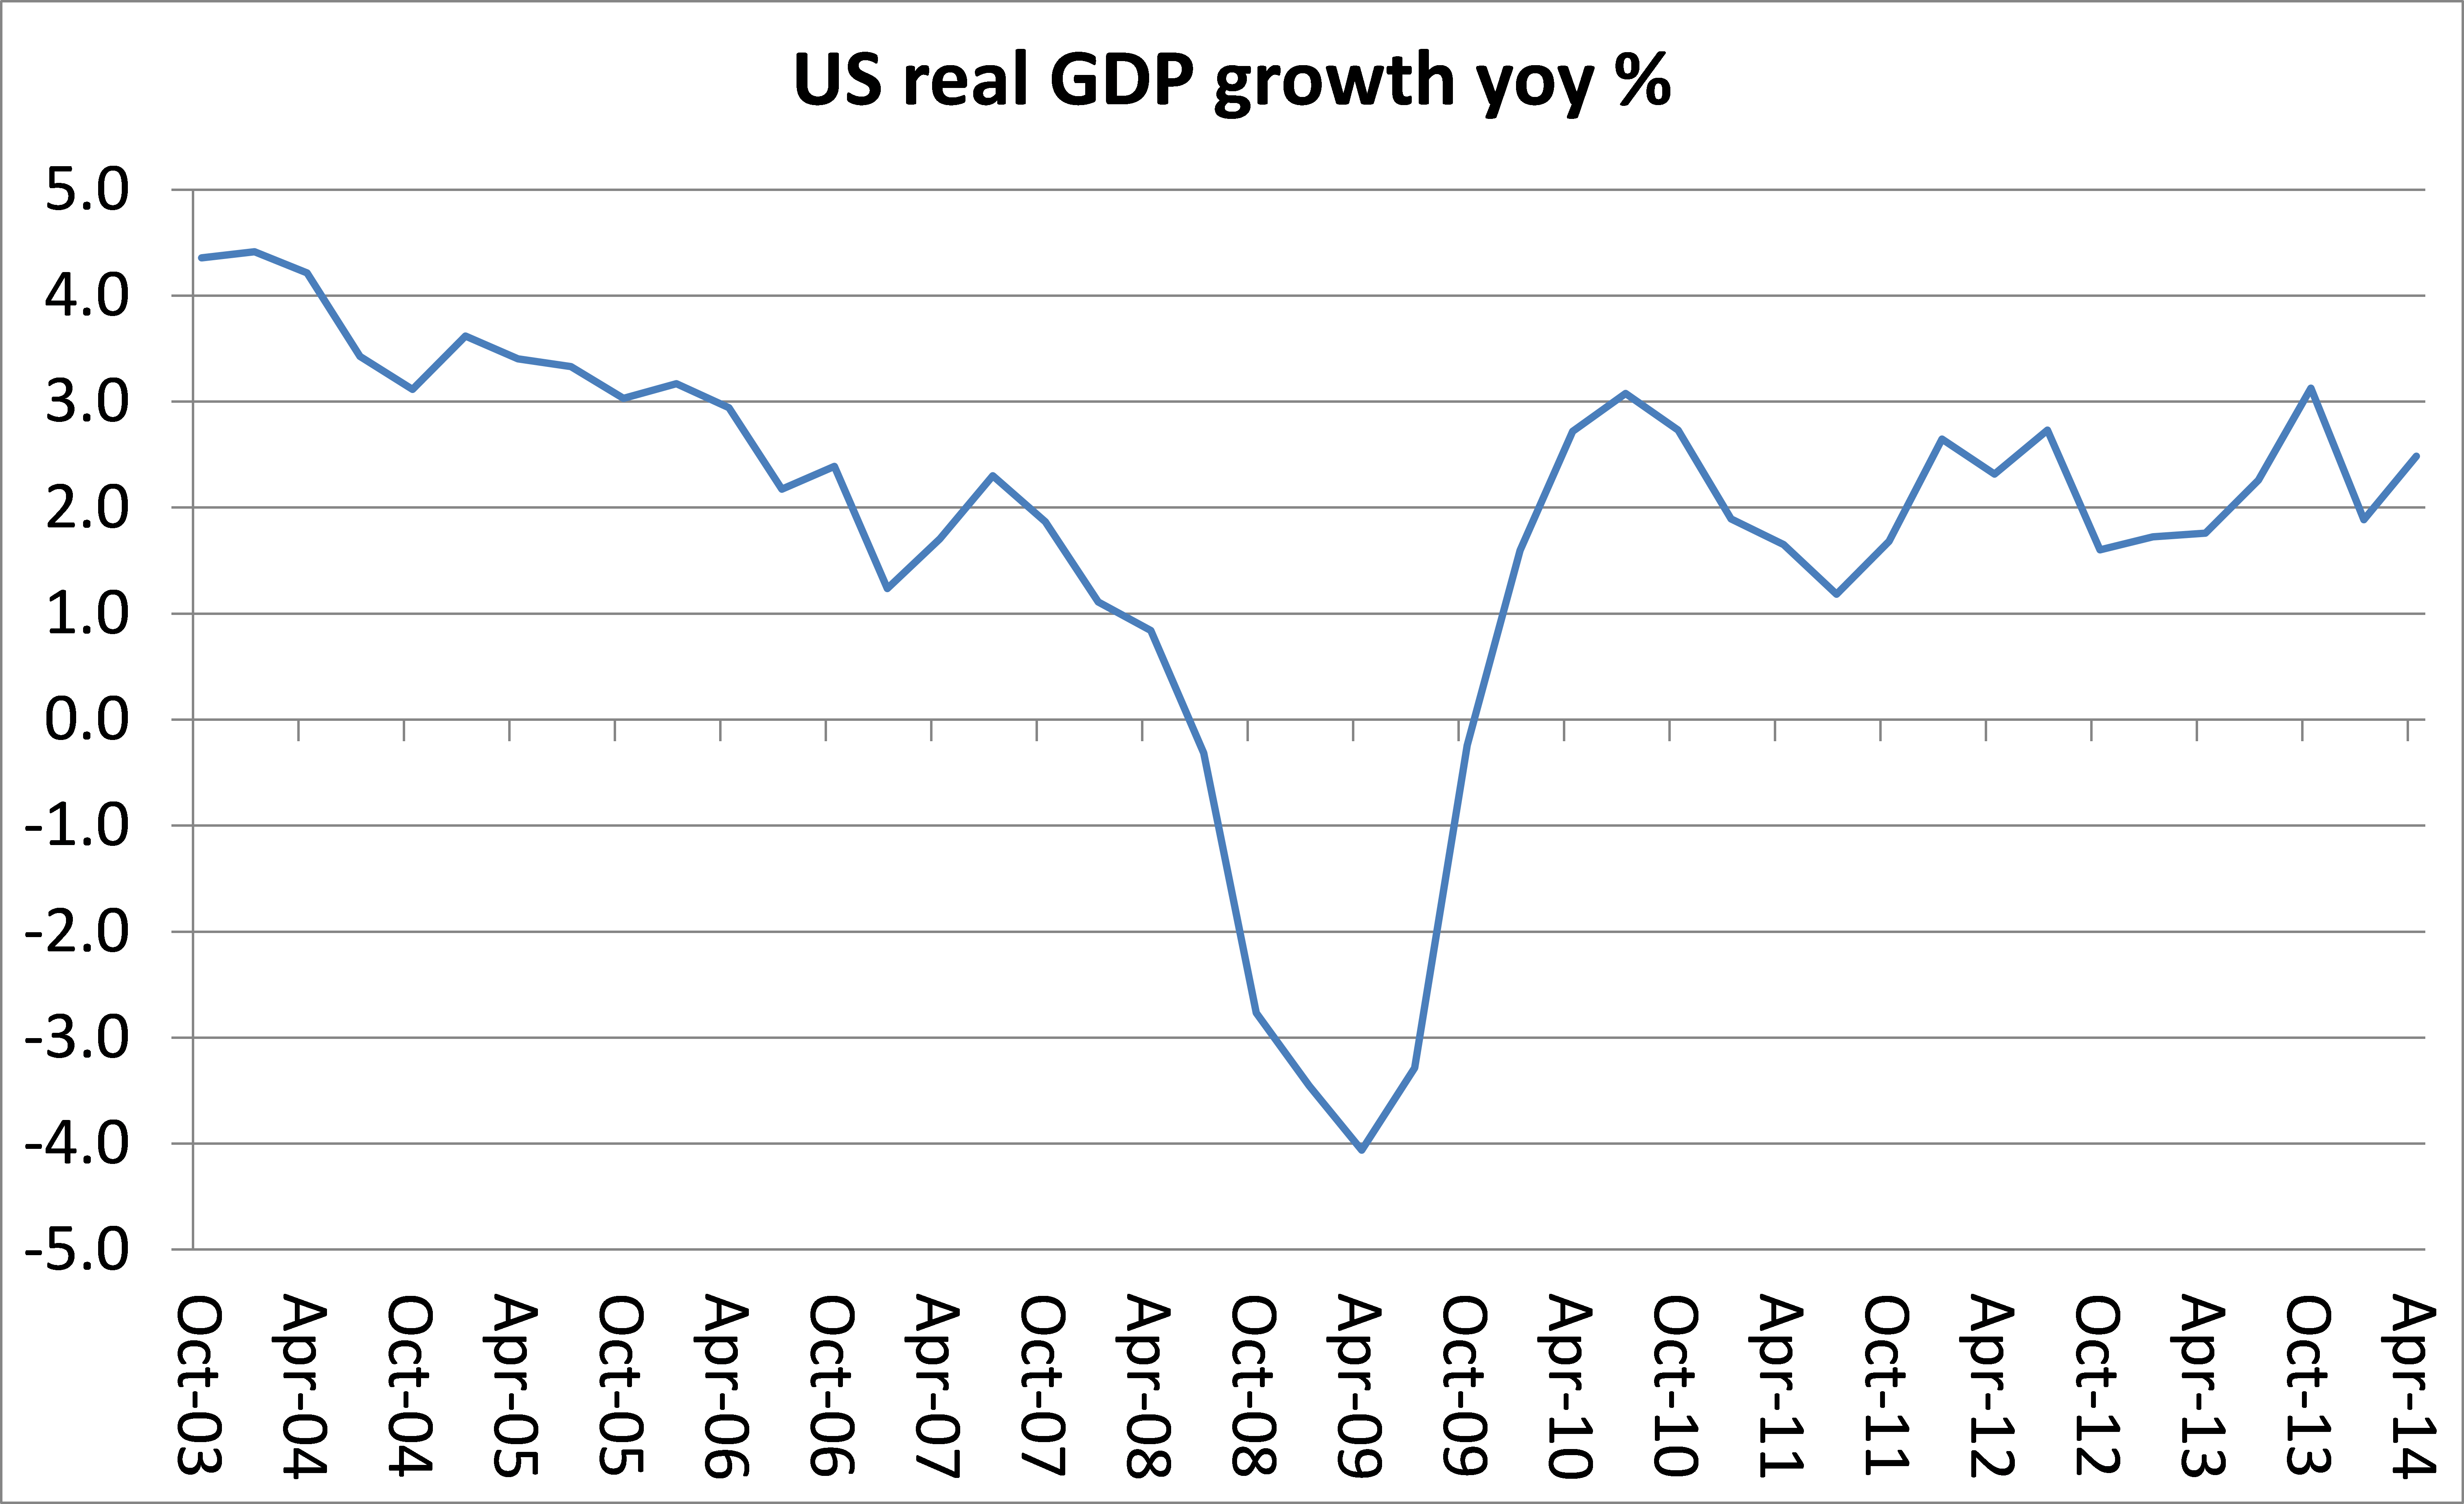
After the revisions, the US economy in real terms has grown 2.4% compared to this time last year. Not bad, and certainly better than anywhere else among the top economies, apart from maybe the UK. But growth in the first quarter was only 1.9% yoy, so in summing up, in the first half of this year, the US economy expanded in real terms by 2.2%. But as you can see, this growth rate is pretty much in line with the trend since end of the Great Recession.
Indeed, the current rate of 2.2% yoy for H1 2014 compared with the average rate of growth since mid-2009 of 2.0%, hardly higher; and with the average in the credit boom between 2002 and the onset of the Great Recession of 2.6% yoy. And the current rate is still one-third below the long-term average rate in the post-war period for the US economy of 3.3% a year. So, not so great. Indeed, US GDP per-capita is 9.8% below the pre-recession trend (graph below from Doug Short).

Also to get the real GDP figure, the official stats assume an annualized quarterly inflation of 2.15%. Yet during the second quarter, the seasonally adjusted inflation index rose at a 3.53% annualized rate. If that inflation rate were used to deflate nominal GDP growth, the Q2 growth rate would be 2.9% not 4.2% and real growth would be close to 2%, with per-capita GDP growth (after taking into account a growing population) just 1.1%.
And this recovery does not feel like one to most Americans. Real annualized per-capita disposable income is now $37,481, up only 2.19% in total since the second quarter of 2008 — a miserable 0.36% annualized growth rate over the past six years. And that’s the average – for most Americans disposable income has fallen. Of course, the forecasts are for a huge pick-up in the rest of this year to take US growth up to 3% or more and so start to change the whole picture – we shall see.
The US economy is clearly stuck in below-trend growth. I have called the period since 2008 a Long Depression and it now seems that even some of the mainstream Keynesian economists are prepared to use a similar term. Brad de Long has now noticed that the US “did not experience a rapid V-shaped recovery carrying it back to the previous growth trend of potential output.” (http://equitablegrowth.org/2014/08/28/start-calling-greater-depression-early-friday-focus-august-29-2014/). Indeed, the recession trough in 2009 saw the US real GDP level 11% lower than the 2005-2007 trend. Today it stands 16% below (see De Long’s graph below). Cumulative output losses relative to the 1995-2007 trends now stand at 78% of a year’s GDP for the United States, and at 60% of a year’s GDP for the Eurozone.


De Long goes on: “A year and a half ago, when some of us were expecting a return to whatever the path of potential output was by 2017, our guess was that the Great Recession would wind up costing the North Atlantic in lost production about 80% of one year’s output–call it $13 trillion. Today a five-year return to whatever the new normal might be looks optimistic–and even that scenario carries us to $20 trillion. And a pessimistic scenario of five years that have been like 2012-2014 plus then five years of recovery would get us to a total lost-wealth cost of $35 trillion.”
As for business investment, which has been performing really badly since the Great Recession, optimism was expressed at the upward revision in the second quarter data. But the yoy rise in business investment at 6.4% was only slightly higher than the post-recession average of 6.1% and business investment as a share of GDP is still lower than it was before the Great Recession.
In my opinion, sustained growth that would be close to the trend average would require a significant rise in the rate of business investment. And business investment growth depends in turn on the movement in corporate profits.
The latest corporate profits figures are really not encouraging on that basis. The data show that corporate profits have been falling in the first half of this year compared to the first half of 2013. As the figure below shows, business investment tends to follow the direction of corporate profits (CPBT) with a lag. As I have shown before, and as the graph below confirms, US corporate profits went negative some six to nine months before the credit crunch began in mid-2007 that kicked off the global financial collapse in 2008 and the Great Recession. Indeed, US real GDP did not contract until mid-2008. In reverse, corporate profits began to rise in mid-2009 well ahead of investment (some nine months later) and GDP. Profits lead investment.

The latest data for corporate profits, if sustained in the next few quarters, would suggest that business investment will eventually drop towards zero. Again ,we shall see. A further decline in the mass of corporate profits will depend on whether the profitability of capital, and in particular, the rate of return on new investment, falls or not. The best data on this will not be available until November, but I shall try to make some forecasts in a future post. If that happens, then it could herald a new recession by the end of 2015. But we are getting ahead of ourselves.
Talking of the US rate of profit, I have been looking again at the long-term trajectory of the profitability of US capital. Dumenil and Levy made an estimate of the US rate of profit a la Marx going back to 1870 (http://www.jourdan.ens.fr/levy/uslt4x.txt). Recently, as part of his analysis of the ‘world rate of profit’, Esteban Maito also made an estimate of the US rate of profit over the same period (see https://thenextrecession.files.wordpress.com/2014/04/maito-esteban-the-historical-transience-of-capital-the-downward-tren-in-the-rate-of-profit-since-xix-century.pdf). His data are exactly the same, because he takes his figures directly from Dumenil and Levy.
Dumenil and Levy measured the US rate of profit using current cost estimates for fixed capital and excluded variable capital (the cost of labour). This is not the best way theoretically to do it (see my paper, https://thenextrecession.files.wordpress.com/2011/07/the-profit-cycle-and-economic-recession.pdf). Using historic costs for fixed assets and including variable capital would be the closest to the rate of profit a la Marx. Using current costs can distort the level and direction of the rate of profit for periods of time, as Andrew Kliman has pointed out (https://thenextrecession.wordpress.com/2011/12/08/andrew-kliman-and-the-failure-of-capitalist-production/). But as Deepankar Basu has shown, over a very long period of time, these distortions will tend to disappear as the impact of inflation or deflation on fixed asset values is ironed out (see BASU capmeasure).
If we take D-L’s data as the best we have for the rise of American capitalism from 1870 into an imperialist power in the 20th century, what it shows is that, over the whole period, there is actually a slight trend upward in the US rate of profit, not down. We can see why in the graph below.

In the post-Civil War boom, a rising American capitalist economy had very high rates of profit. The Depression of the 1880s drove that down sharply. Then there was a recovery that peaked at a lower level in the mid-1890s before falling again. World War 1 got the rate up a bit with a rise to a new peak in 1924. The decline after that presaged the Great Depression of the 1930s. World War 2 pushed the US rate of profit into the stratosphere and signalled a new hegemonic role for US imperialism and the age of Pax Americana. World wars are great for profitability, particularly for the US. The US rate of profit is still higher than in the inter-war period. Indeed, only the post-civil war boom period of 1870s saw higher rates. WW2 transformed the US ROP and its global power status. So US capital has had a higher ROP in the last 70 years since 1945 than it did in the 60 years before 1945.
The drop in profitability post-1965 coincided with revolutions in Europe: Spain, Greece, Portugal; in Vietnam, Latin America and parts of the Middle East; as well as intensified class struggle in France, the US and the UK. A rising rate of profit in the so-called neoliberal era of the 1980s and 1990s coincided with reaction, the collapse of the Soviet Union, the end of the cold war and a brief New World Order around US dominance.
But since the late 1990s, the US rate of profit has stagnated at best, now engendering a long depression in growth and investment, as discussed above. Pax Americana has waned too (as the failure of US imperialism’s objectives in Vietnam, Somalia, Iraq, Afghanistan, Syria and Ukraine show). American hegemony is increasingly difficult to sustain as the profitability of American capital stagnates or falls.

Hi Michael,
The SP 500 is going too high. How bad is this right now? http://goo.gl/A7MMcz
Daniel
See my posts: https://thenextrecession.wordpress.com/2014/08/01/the-risk-of-another-1937/
https://thenextrecession.wordpress.com/2014/02/07/waste-bear-markets-and-fictitious-capital/
https://thenextrecession.wordpress.com/2012/07/15/what-does-the-stock-market-tell-us/
“But as you can see, this growth rate is pretty much in line with the trend since end of the Great Recession.”
The interesting thing in this chart, however, is that it shows a declining trend in the rate of growth from 2003 to 2008, from over 4%, down to 1%, but a rising trend line of growth with higher highs, and higher lows in the growth after Apr 2011 rising from 1% to 2.5%.
Michael,
Well said. Indeed a new Long Depression. BraddeLong gives convincing information.
friendly regards,
Henry
There was (unfortunately) no revolution in Spain in 1960’s. At best, some degree of sharping in class strugle. The insufficience of labour resistance can be explained only by fascist terror imposed by general Franco.
Congratulations, and thanks, for your ever interesting blog.
Best regards
escaiguolquer, I was gonna point that out and ask Michael what he meant by revolution (maybe he understands the transition from dictatorship to a liberal democracy).
Apart from that, the article is a great read Michael, as always, thanks!
Yes, I meant the overthrow of fascist/military regimes in Portugal, Spain and Greece in the 1970s.
Shouldn’t the rate of profit be a clear downward correlation? Is off shoring and immigration and automation the main increases of ROP in the post 1970s era?