The mass protests, demonstrations and actions that have shaken and still are shaking the pro-capitalist governments of Turkey, Brazil and Egypt show that the key emerging capitalist economies are not immune from the slump that has engulfed the advanced capitalist economies. The advanced economies still contribute some 55-60% of world GDP (depending on how you measure it). They remain the dominant influence over the world capitalist economy.
The Great Recession and the subsequent weak recovery have led to a significant fall in trade and investment flows to the emerging economies, particularly to the largest so-called BRICS (Brazil, Russia, China, India and South Africa). Their growth rates have also begun to fall away. In addition, the largest by far of the BRICS, China, is experiencing a 2-3% pt fall in its super-fast growth rate and that has been enough to cause sharp drop in the demand for commodities (agricultural and raw materials), the main exports of other emerging economies. So the crisis is a world-wide one.
Take Brazil. The nationwide street demonstrations of the past few weeks have sent shockwaves through Brazil’s political elite. There is widespread discontent with a ruling class that is seen as self-serving and corrupt. More than a million Brazilians have poured on to the streets in recent weeks to protest against a litany of grievances, from corruption and poor public services to outrage at billions of pounds in taxpayers’ money being spent to host the 2014 World Cup. It seems that the carnival for Brazilian capitalism of recent years is now over.
How has Brazil’s carnival of capital played out? We can look at the Brazilian economy from a Marxist viewpoint by analysing the movement in the rate of profit for the whole economy. Using the Extended Penn World Tables as my source data and my own calculations, I reckon the rate of profit in Brazil moved like this.

So between 1963 and 2008 (the latest year, I have), the rate of profit declined secularly by about 19%. But this secular fall was really the product of the very large decline in the rate of profit from 1963 to the early 1980s and 1990s. Over these 20 years or so, the rate of profit fell over 30% while the organic composition rose 23% and the rate of exploitation fell 17% – a classic example of Marx’s law of profitability at work.
But from the mid-1990s, Brazil’s’ ruling elite adopted neo-liberal policies designed to restore the rate of profit. Between 1993 and 2004, the rate of profit rose 35%. The organic composition of capital rose 20% as foreign investment flooded into new industries (autos, chemicals and petroleum), but the rate of exploitation rose even more, up 55%, as more Brazilians entered the industrial and agro processing labour force with intensive capitalist production methods, while wages were held down.
Over the last three decades Brazil became a major agricultural producer and exporter to the world market. Leading exports include soybeans and products, beef, poultry meat, sugar, ethanol, coffee, orange juice, and tobacco. Brazil’s agrifood sector now accounts for about 28% of the country’s GDP. Brazil’s is now the world’s third-largest agricultural exporter (in value terms), after the US and the EU. Rapid export growth was accompanied by changes in the composition of agricultural exports away from tropical products to processed products – up the value-added scale. Processed products now account for about three-fifths of agricultural exports.
And Brazil, like some other emerging economies, benefited from some other favourable external factors that supported the neo-liberal policies at home. Food commodity prices rose. In a way, it was like the discovery of North Sea oil that helped Britain’s Thatcher government in the 1980s. The income windfall to Latin America from persistently high commodity prices over the past decade has been unprecedented. It averaged 15% of domestic income on an annual basis and close to 90% on a cumulative basis.

So a combination of rising commodity prices driven by Chinese demand, productivity gains as the rate of exploitation rose and the expansion of employment from the rural areas boosted profitability and growth for a decade. After the 2002 crisis, GDP growth averaged above 4% per year until 2010. This led to significant improvements in living standards and life in general.
But the iniquities of capitalist development remained embedded in the system. Inequality of income and wealth in Brazil remains at extreme levels, exceeded only by post-apartheid South Africa – and when measured by a gini coefficient per capita, Mexico. Note Turkey is next.

Despite the boom of the last decade, average household net-adjusted disposable income in Brazil is still way lower than the OECD average of $23,047 a year – and that’s the average. Over 16 million people are still living in what is deemed extreme poverty, with monthly incomes of below 70 reais (about $33). Some 80% of men are in paid work, compared with 56% of women and 12% of employees work very long hours, higher than the OECD average of 9%, with 15% of men working very long hours compared with 9% for women. Around 7.9% of people reported falling victim to assault over the previous 12 months, nearly twice the OECD average of 4.0%. Brazil’s homicide rate is 21.0, almost ten times the OECD average of 2.2, one of the highest in the world at 21 per 100,000. Violence is concentrated among young people and over the past decade and a half, violence – including armed violence – has become a major social problem in the country. And Brazil’s regional disparities remain very high: average GDP per capita varies from just 46% of the national average in the Northeast region to 34% above the average in the Southeast.

Under the government of former president Lula and the commodity boom, there were some important gains for the working class: a social protection system, increasing credit at low interest rates for workers and universalising health and education. The Bolsa Familia, or family allowance programme, is the most visible face of these policies. Between 2004 and 2011, the number of families benefiting from income transfers more than doubled, from 6.5 million to 13.3 million, representing nearly one-quarter of the population. In the more isolated regions, payments under this programme have become the principal engine of the local economy. Another pillar of government policy, adopted through negotiations with the unions, was to raise the minimum wage and associated pension. It went up by 211% in nominal terms between 2002 and 2012, for a real inflation-discounted increase of 66%. Unemployment rate plunged from 12.3% to 6.7% and the labour force expanded at a 1.6% yearly rate.
However, during this boom, Marx’s law of profitability was still at work. From 2004 the rate of profit began to fall (down 8% to 2008 and more since), as wages shot up and the rate of exploitation dropped 25%. It was only the continued boom in food commodity prices that kept growth going.

The fall in profitability since 2004 was mirrored in other major emerging capitalist economies (see my post on Turkey for a similar trend, https://thenextrecession.wordpress.com/2013/06/03/turkey-cant-see-the-trees-for-the-woods/). In my paper, A world rate of profit (roberts_michael-a_world_rate_of_profit), I show that the rising rate of profit in the emerging economies was able to push up the overall world rate of profit through the mid-2000s, but not since then.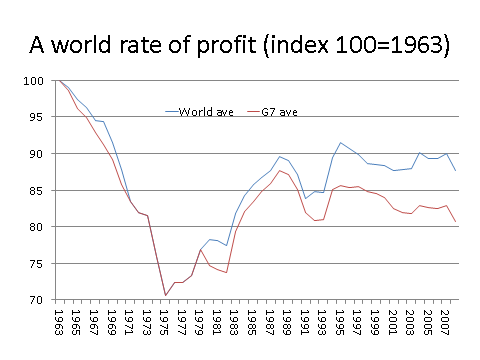
When the global slump came in 2008-9, the emerging capitalist economies could not avoid the consequences. In the case of Brazil, it seemed that rising commodity prices plus a deliberate policy by the government to increase state-financed investment had enabled Brazil to avoid the worst of the slump compared to others.
But prices for Brazil’s key agricultural exports began to falter from 2011 onwards. In the last year, global commodity prices fell back sharply and profitability began to fall further. Now Brazil’s export profitability is some 20% below its best years before 2004.

Brazil’s GDP growth has consequently slowed since 2011. There has been a sharp fall in manufacturing investment and exports over the past two years. While public investment increased by 0.4% points to 5.4% of GDP, it has not been enough to compensate for the fall in the ratio of private investment to GDP from 14.3% to 12.7% last year. Industry has not even returned to its pre 2008 crisis production level.
The government has tried to get private sector investment going through tax cuts and incentives for the corporate sector but only at the cost of running up a deficit on its budget. Interest costs on the public debt have been mounting, forcing the government to cut subsidies to transport, housing and education on which the majority rely. It was the last straw to spend huge amounts on football and the Olympics (partly to boost capitalist sector profits) at the expense of basic public services. Thus the eruption of protest.
What now? Dilma Rousseff’s approval rating has sunk by 27 percentage points in the last three weeks. The share of people who consider Rousseff’s administration “great” or “good” plummeted to 30% from 57% in early June, according to a Datafolha opinion poll, the sharpest drop for a Brazilian leader since 1990, when Fernando Collor outraged the population by freezing all savings accounts in a desperate attempt to stop hyperinflation. 81% said they support the demonstrations. Asked if the protests had resulted in positive changes, 65% said yes.

The unrest has prompted a flurry of government promises to improve public services and other measures aimed at quelling the protests. In the past week alone, Brazil’s Congress voted on a battery of bills promoting issues popular with the protesters, and the supreme court ordered the arrest of a lower house representative convicted of corruption. Rousseff is now seeking congressional support for a non-binding referendum to ask Brazilians how they would like to see the political system changed.
But while the government appears to be making paper concessions, in reality it has no intention of reversing its neo-liberal policies. Finance minister Guido Mantega made that clear when he said that he will “raise taxes or cut public spending to compensate for any future subsidies it offers to support struggling sectors”. Profitability in the capitalist sector will not recover without further hits to living standards and economic growth will remain low as long as the world economic recovery remains weak and China slows down. The carnival is over.

Michael,
The usual explanation of revolutions from a Marxist perspective is that material conditions have changed in favour of the rising, revolutionary class, not that they have worsened. It was the rising power of the commercial and landed bourgeoisie that provoked the English Civil War, and the Great French Revolution, it was the economic boom of the 19th Century, and subsequent growth of an urban middle and working-class that provoked the Revolutions of 1848.
Paul Mason’s accounts of the material conditions that provoked the “Arab Spring” paint a similar picture of a newly established large, middle class given greater social weight by rapid economic growth, as he points out, very rapid in the case of Libya, that begin to flex their muscles and demand rights, particular political rights, and so on.
Some kind of short term event, as with the issues over transport in Brazil, can be the spark to such rebellions, but they are normally just a spark to what are deeper social changes brought about by rapid economic development, that gives strength to the revolutionary classes.
Trotsky makes the same point against the Ultra Lefts in his articles “Flood-Tide” and “The Curve of Capitalist Development”. The ultra-lefts had a very crude theory that it was economic crisis that provoked working-class uprisings. In fact, Trotsky points out it is economic booms that create the best conditions for workers to make advances. Economic downturns may create hostility within the ranks of the working class, he points out, but at the same time create the worst conditions for them to do anything about it. Economic weakness creates greater competition between workers for jobs etc. it increases their atomisation, weakens their organisations, and creates a feeling of despair.
Boffy
I tend to agree. I’m not suggesting revolution is imminent in Turkey or Brazil and did not say so.
And one day there will be another, much greater, Tiananmen Square.
Hopefully with a better result than the original. But yes, the case of the US working class is a good example – militancy has at its highest at the crest of the postwar expansion, in decline ever since.
Not to mention that there is a political caste that undeniably benefits from the increased misery and isolation of the poor.
I’m a new reader to your blog, so sorry for the question. How do you count the organic composition of capital in some national economy, what data you use for that?
The organic composition of capital is a Marxist category. It measures the ratio of the value of the stock of the means of production and raw materials held by the capitalist sector (constant capital) against the value of the cost of employing the labour force (variable capital). This ratio is very important in the marxist theory of crisis because marx reckoned that a rising organic composition of capital would lead to a fall in the average rate of profit in the capitalist sector over time. And a fall in the rate of profit would eventually lead to a fall in the mass of profit and then a crisis of accumulation and slump.
Measuring the organic composition of capital is not easy because the categories have to be defined in terms of the national accounts of each economy and they can vary a lot. Marxist economists spend a lot of energy trying to measure it accurately with varying degrees of success! In the case of Brazil and other emerging economies it is doubly difficult. In this case I have used the extended Penn World Tables of data that have been compiled by Marxist economists in the US and cover various countries around the world You can also use national accounts in each country to try and work it out. See my paper, A world rate of profit, cited in the post.
Thank you! Do I understand it correctly that in Extended Penn World Tables it should be K/N*w? Or it is simply k (capital-labor ratio)?
Pavel
I used K/N*w
Marx’s explanation is not a theory that correlates improving or worsening conditions for a revolution with improving or worsening material conditions. In this regard, Marx is neither a “crisis=revolution” theorist, nor “growth=revolution” theorist.
In his A Contribution to the Critique of Political Economy, he proposes the well-known, oft-cited, sometimes abused: “At a certain stage of development, the material productive forces of society come into conflict with the existing relations of production or–this merely expresses the same thing in legal terms–with the property relations within the framework of which they have operated hitherto…Then begins an era of social revolution.”
Marx’s critique being the immAnent, not imminent, critique of capital, this conflict exists at the very origin of capital, is inherent to the organization of labor as value-producing, social labor, expropriated by private property BUT the immanent conflict becomes manifest AS and At moments; and those moments can occur during periods of expansion, or as the legacy or “hangover” of that expansion, triggering “civil protests” which are at core, issues of labor (for example the civil rights struggle of African-Americans in the US that was precipitated by the disruption of plantation-sharecropper relations by the mechanization of US Southern agriculture during WW2, and ultimately reaching to the heart of US industry, with the development of DRUM and the LRBW in Detroit).
It can occur also during periods of contraction, which itself is the legacy of a failed expansion– Spain for example in the 1930s, and I would argue, Spain (and Portugal) again in mid 1970s.
In any case, the significance to the decline in the rate of profit is that the decline speaks directly to, makes manifest, the limits to capital as a self-valorizing system. It, the decline in the rate of profit makes manifest the conflict between the labor process and the valorization process; a conflict that is preceded as Marx says in his Grundrisse by a change, an alteration between the technical and living components of the production process.
The significance of such decline for the prospects of revolution is that it will propel the bourgeoisie to attempt offsets, and those offsets are, as capital is itself, a class relation, a class struggle.
The struggle is immanent and imminent. The resolution is neither.
Sartesian
I think I agree with your analysis. In my book, The Great Recession, I tentatively tried to take this question a bit further, not entirely convincingly I must conceded.
Thanks. Just started your book. I wouldn’t worry about being “entirely convincing.” The task is to “push” the issue and see where it takes us.
Yeah I’d agree, it would be the same mechanical error in the other direction to assume that a downturn is always the least favorable condition for class struggle. Instead I think the struggle tends to be displaced away from the shop floor – without ever really abandoning that critical area, vide the BART strike in the SF Bay Area http://www.motherjones.com/mojo/2013/07/bay-area-transit-strike-why-it-matters – towards other arenas.
Indeed it may be that during downturns, especially extended stagnations, that the class struggle is necessarily displaced onto more political arenas. In that sense such periods may be *more favorable* from a revolutionary perspective.
What about Alan Freeman’s rate of profit measurement?
When yours goes up in the 90’s his goes down, being that he puts financial investments in the denominator this would show “financeliazation”
I differ from Alan Freeman on the measurement of the rate of profit in the US and the UK. I reckon that the US rate of profit even measured by historic costs rose from 1982 to 1997, thereafter falling. Alan starts from the view that it fell in the US and so wants to explain why it rose in the UK. He reckons that if you add in financial assets to the denominator, it will show a fall in both cases. I think adding financial assets in the way he does is ‘double counting’ and does not work. These issues are presented in my post: https://thenextrecession.wordpress.com/2011/07/29/measuring-the-rate-of-profit-and-profit-cycles/ and see my paper cited there. The issue of double counting is dealt with in my paper: Debt matters https://thenextrecession.files.wordpress.com/2012/11/debt-matters.pdf see pp10-13
Thanks for the extended paper on this issue. Fits into my current research on the theory of money – not only Marxist, but the various “monetary theory of production” (MTP), post-Keynesian as well as more orthodox neo-classical. The theory of money, and not the old struggles over the transformation issue or the TRPF, is the main theoretical battlefield today, IMO.
Will carefully read and comment!
Regarding this conflict between means and relations of production, I think it would be worthwhile to look at the evolution of landed property (and therefore landed labor relations) in Brazil. All history being the history of relations between city and countryside, as Marx said, Brazil still is entwined in the legacy of the Portuguese “empire,” of which it was the seat (courtesy of the British, who transported the monarchy to keep it safe from the reverberations of the French Revolution), and the fragmented nature of the plantation production in Pernambuco, Bahia, etc., and the use of mules and mule trails as the primary means of “back country” transport.
While intraurban transport seems to be the flashpoint for these demonstrations, transportation between the rural and urban/port areas is nowhere adequate, organized enough, or cheap enough. I think the US Dept. of Agriculture did a study some years ago that showed Brazil’s advantage in production costs, mainly due to cheaper labor, in its soybean exports was almost entirely negated by the higher transportation costs, and greater transportation times.
I’ll see if I can find the study.
See the chart in this report: http://www.fas.usda.gov/info/IATR/030612_Brazil/
Great article! Thanks Michael. I like the way you argue so clearly and concisely with supporting evidence and data.
@Michael Roberts
What is wrong with financial investments in the denominator in your view?
Don’t the capitalist get a rate of return on financial investments to?
Yes they do. But the problem is first theoretical: is this financial capital really just a fictitious representation of tangible capital and 2) a measure that avoids the double counting of this capital, first the tangible capital and then its fictitious representation. If we just add to the denominator all financial debt held we are not taking into account the financial assets held for that debt. We need a measure of net worth. My paper tries to use net worth – I am not sure satisfactorily. On my measure of profitability against net worth (tangible plus financial), the US rate of profit rises and stays high through 1970s to 1997 and then plunges to rejoin the rate of profit on tangible assets. Indeed, the rate of profit on net worth falls below that of the rate on tangible assets alone. That suggests that ‘financialisation’ failed to stop Marx’s law operating indefinitely and instead left a huge burden of fictitious capital to be deleveraged. But more work needs to be done to understand this.
Ok, I’m going to read your paper soon but I have one more question.
If Alan double counts why do you think his rate of profit is historically at a lower % ?
I’d have to go and look at Alan’s piece again and his data. But I suspect we may be using different categories and or time series for our data. The main thing is the trend and fluctuations, I think. The level will be set by whether profits are before tax or after,whether the whole corporate sector or the non-financial; whether historic or replacement cost etc. I used historic cost I think but Alan uses replacement cost and that makes the level of the rate of profit much lower.
?
Well wouldn’t replacement cost make it even higher?
That and I don’t think Alan would be guilty of making that mistake
See Andrew Kliman’s book, The failure of capitalist production p114 where he shows that replacement cost rates of profit were anywhere between 35-70% of historic rates in the US in the post-war period. The reason is that net fixed assets measured in historic costs start lower than in replacement costs.
As for Alan’s analysis, I refer you to the comments on his piece by various people at the Journal of Political Economy http://australianpe.wix.com/japehome#!freeman-finance/cdjh
In his paper, Alan says that he uses as net fixed assets for the US from the BEA capital stocks table 1.1 which is a current cost measure. He does so, I think, because the UK stats do not have an historic cost measure, so he decides to use current costs for both the US and the UK. Actually I have done an adjusted measure for historic costs for the UK and, on this issue, it does not make much difference.