UK Chancellor George Osborne in the right-wing Conservative-led coalition, backed by the bulk of the media, has been talking up the startling ‘recovery’ in the UK economy. According to recent ‘economic activity’ indexes, UK growth has been running at above 5% annualised for several months compared to about 1.5% at the start of the year.

From forecasts of near flat real GDP growth at the beginning of 2013, the Office for Budget Responsibility (OBR) now forecasts a 1.4% yoy rise in 2013 (from 0.6% yoy previously) and 2.4% in 2014 (from 1.8% previously). If achieved, the UK would be the fastest growing G7 economy next year. In his Autumn statement to the UK parliament, Osborne naturally claimed that this confirmed the correctness of the government’s pronounced fiscal austerity measures and confounding the Keynesian critics.
But ‘activity indexes’ are not hard actual data. The proof of the pudding is still in the eating. And remember, although the UK economy does appear to have expanded faster than expected in 2013, it has nowhere near recouped the huge loss in real output that it suffered during the Great Recession. Osborne admitted in his speech that the fall in the UK real GDP in 2008-9 was not 6.3% as previously estimated but a staggering 7.2%. Indeed, the collapse in the UK economy was greater than in all the other G7 economies, confirming my prediction back in 2009 (in my book The Great Recession) that the heavy ‘rentier’ nature of the UK economy, with its huge financial sector, would mean it would suffer most.

The OBR now forecasts that the UK unemployment rate would fall to about 7% by 2015 and then to 5.6% by 2018. If this was achieved, it would still mean a higher unemployment rate than before the start of the global financial collapse and the Great Recession.
So where is this recovery coming from? Well, it is not coming from the manufacturing sector. The hard data show that British industry remains in the doldrums with only the slightest sign of a pick-up.

And it is not coming from any recovery in business investment. On the contrary, according to the OBR, business investment remains some 25% below its peak at the beginning of 2008.

This awful performance in business investment can be easily explained by the continued failure of corporate profitability to recover to pre-crisis levels, as the official figures on the net return on non-financial sector fixed capital reveal.

Moreover, according to the preliminary figures for GDP expenditure components in 2013 Q2 and Q3, almost 80% of the growth in those two quarters was the result of a rise in stockbuilding. What that means is that firms have been producing more or buying more and stockpiling it in the hope of selling it later. If these stockpiles remain, then production will have to be curtailed eventually. So the risk is that recent growth will not be sustained. And it is also clear that the recovery in growth is not coming from a boost in exports. On the contrary, UK export share continues to shrink in world markets.

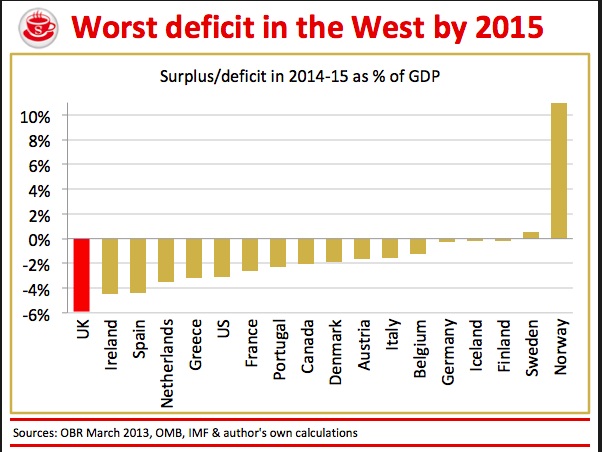
And the recovery is not coming from a relaxation of the government’s austerity measures. Indeed, according to the OBR data, the fiscal stance in the current year will have tightened by about 1.2-1.8% of GDP, which is little different from the average since 2010. And Osborne announced no change in its austerity measures to 2019. Indeed, he tightened them further by announcing a cap on welfare spending and a sharp rise in the state pensionable age from 65 to 68 for those retiring in the 2030s. Even so, so large was the government deficit back in 2008 (well over 11% of GDP), the UK deficit will still be the largest among advanced capitalist nations in 2015. And the deficit reduction target set in 2010 will still be missed by three years.
So that only leaves a consumer boom as the cause of the current spike up in GDP. Most people in Britain might ask: what consumer boom? Real household incomes have been falling since 2008 so how can there be more spending? The answer is two-fold. First, households are running down their savings and those who used to save a little each month are now spending it to meet higher energy, transport and housing costs. As investment by businesses falls, households have increased their spending from lows in 2012. The government is freezing some rail and transport fares in real terms for a year and cutting energy bills slightly for some. That will make little difference.

This extra real consumer spending is not in everyday purchases but in luxury goods by the rich (champagne sales have doubled) and in house buying with government-backed cheaper mortgages and cash-rich wealthy buyers. New house building remains pathetic, especially for affordable homes, where completions remain at just 40,000 a year.

It is estimated that current housing supply levels will mean that London will have a deficit of 559,000 homes by 2021 – which even when excluding factors such as overcrowding still amounts to 329,000 fewer homes than London will require. So what we have behind this economic recovery is really a credit-fuelled boom in existing real estate. The government’s Help to Buy scheme is allowing investors as well as expectant homeowners to get a mortgage and a deposit. As I suggested in a recent post, https://thenextrecession.wordpress.com/2013/11/30/secular-stagnation-or-permanent-bubbles/, this poses a danger of another housing bust as the BoE’s house price index indicates.

As the BoE has pointed out, low- to middle-income households are badly exposed if mortgage rates were to rise. Nearly a third of mortgage debt is held by households that have borrowed more than four times their income; and a sixth of it is held by those who have less than £200 a month left after spending on essentials. The BoE wants to start raising interest rates as soon as the unemployment rate falls below 7% and we are told that will now happen in 2015. If the BoE actually implemented this hike in rates, the whole property house of cards could start to tumble and bring the UK economy down with it. The government will no doubt hope that would be after the next election, which will be no later than in May 2015. But if the current rate of decline in unemployment continues, that 7% threshold will be reached in 2014 not 2015. So it is more likely that the BoE will not start to normalise rates then after all. So the credit boom will be allowed to continue.
The nature of this startling recovery thus seems to be lumpy – concentrated in the unproductive sectors of property and financial assets rather than in investment and production. And the government has little intention of correcting that ‘imbalance’. It claims it wants to increase infrastructure investment to ‘kick-start’ the economy with a £375bn ‘pipeline’ of public and private sector projects. But this is really just a ‘wish list’. Infrastructure spending fell 13% last year. And three-quarters of the £375bn is supposed to come from the private sector – fat chance. In contrast, selling off the nation’sassets will continue after the sale of the Royal Mail (postal service) at a ludicrously low price to hedge funds and the selling of shares in the partially-owned Lloyds Bank (at a tiny profit). The government will now double its target for the disposal of state assets to £20bn over the next six years, including the sale of its 40% stake in Eurostar.
The lumpiness of this recovery is also revealed in the shift of incomes from the poor to the rich and from the regions to London. The pay of workers in their 20s has tumbled by almost 12% since the peak of the recession, the Resolution Foundation estimates and Tax Research finds that self-employed incomes of plumbers, electricians and other trades have dropped over the last decade and steeply since the 2008 crash. The inflation adjusted hourly rates of all workers fell by 8.1% over the same period.
The UK may be growing faster as the result of yet another ‘credit bubble’, but what is happening elsewhere? As I write, revised figures for US GDP in Q3’2013 were released. The estimate for US real GDP growth was hiked to 3.6% at an annualised rate compared with 2.5% in Q2. That sounds good, but looking through the figures, the acceleration in growth is, like it is in the UK figures, due to a sharp rise in stocks. Private consumption, business investment and export growth slowed in Q3 compared with Q2. Corporate profits growth also slowed to under a 2% annual rate. So there is no real change there from a picture of a crawl.
The GDP figures are hard data. But the media and some mainstream economists prefer to highlight the rises in activity indexes, like the purchasing managers index (PMI), for many economies. These are surveys of how company executives see business activity. They are high-frequency measures and offer a reasonable guide to the future. But they are not hard data. For example in the case of the UK, the activity index for services is now way out of line with the hard data index for services. So either the activity index will fall towards the hard data or vice versa. Moreover, the activity index shows a growth rate of only about 2% and the hard data at well under 1% – hardly a breakneck pace!

Nevertheless, I have relied on activity indexes in this blog to see where the major economies are going. The latest November data on my own composite (manufacturing and services) ISM index for the US show little change from the slow growth picture.

The even more frequent weekly ECRI gauge continues to show the same story, albeit with slight upward trajectory.

And if we look at PMIs across the major economies for November, it shows expansion is continuing. But in some areas, the UK, the US and the Eurozone, there is a slight slowdown from October.

Economic growth in Britain may have accelerated in the second half of this year from near stagnation at the beginning, but this pick-up appears to be based on a credit-fuelled property and financial asset boom to achieve a paltry 2% or so growth rate. Elsewhere, the major economies continue to trundle rather than sprint forward.
