In previous posts, I have noted the apparent conundrum of corporate sectors in the US, the UK and other major capitalist economies having apparently large cash reserves from accumulated profits which they are failing to invest in new plant or equipment technology (https://thenextrecession.wordpress.com/2013/10/19/the-fallacy-of-causation-and-corporate-profits/). In previous posts, I have argued that while some corporate sectors have seen sharp rises in total profits, profitability (profits relative to the stock of capital) has not recovered from the Great Recession sufficiently to encourage comparable new investment (https://thenextrecession.wordpress.com/2013/09/17/nobodys-investing/).
In addition, the bulk of the corporate sector of the major economies continues to hold sizeable debt, which needs to be serviced or paid down deleveraged), before new investment can commence. Finally, corporations have used more of their profits to buy back their shares to boost stock prices or pay higher dividends, rather than invest in new productive capacity. Now several readers of my post have thrown cold water on these causes as an explanation. So I’m minded to return to the issue to see if we can throw more light on what is happening.
First, let’s be clear on the current situation. Take the US. The level of corporate fixed investment as a share of corporate cash flow is at 25-year lows.

In another excellent post (http://socialisteconomicbulletin.blogspot.co.uk/2013/10/the-cash-hoard-of-western-companies.html), fellow Marxist economist, Michael Burke, has outlined the extent of this ‘cash hoarding’ in a similar way to my graph above. Comparing US corporate fixed capital formation to corporate operating surplus, Burke finds that “the increase in profits has not been matched by an increase in nominal investment. In 1971 the investment ratio (GFCF/GoS) was 62%. It peaked in 1979 at 69% but even by 2000 it was still over 61%. It declined steadily to 56% in 2008. But in 2012 it had declined to just 46%…. If US firms investment ratio were simply to return to its level of 1979 the nominal increase in investment compared to 2012 levels would be over US$1.5 trillion, approaching 10% of GDP. This would be enough to resolve the current crisis.”
Burke reckons that Us companies have used their rising profits either to increase dividends to shareholders or purchase financial assets (stocks): “one estimate of the former shows the dividend payout to shareholders doubling in the 8 years to 2012, an increase of US$320bn per annum.” Burke goes onto to point out that cash hoarding is happening in other economies too: “In 1995 the investment ratio in the Euro Area was 51.7% and by 2008 it was 53.2%. It fell to 47.1% in 2012. In Britain the investment ratio peaked at 76% in 1975 but by 2008 had fallen to 53%. In 2012 it was just 42.9% (OECD data).” And the cash hoards wer up sharply: “The total deposits of NFCs in the Euro Area rose to €1,763bn in July 2013 of which €1,148bn is overnight deposits. This is a rise of €336bn since January 2008, nearly all of which is in overnight deposits, €306bn. In Britain the rise in NFCs bank deposits has been from £76bn at end 2008 to £419bn by July 2013.”
Over in Canada, in a new blog, Michal has noted the same phenomenon (http://politicalehconomy.wordpress.com/2013/12/03/canadas-profitability-puzzle/): “the ratio of investment to profits has been falling steadily for the past two decades and now sits at just above 60%. Companies are putting less and less of their earnings back into their stock of buildings, machinery and other equipment – the tools they use to produce goods and services. For every dollar earned before tax, only about 60 cents goes back into maintaining and expanding business capital. Compare this to 80 or more cents just a decade ago.” As does Jim Sranford at Unifor: http://www.progressive-economics.ca/2013/11/14/good-time-to-rethink-corporate-tax-cuts/: ” Because corporations are taking in so much more than they are spending, liquid cash assets in the non-financial corporate sector continue to swell, and now total almost $600 billion.”
Burke notes that this hoarding began well before the Great Recession and this is significant. In the last 25 years, firms have been increasingly unwilling to make productive investments, preferring to hold financial assets like bonds and stock and even cash which has limited returns in interest. Why is this?
Well, it seems that companies have become convinced that the returns on productive investment are too low relative to the risk of making a loss. This is particularly the case for investment in new technology or research and development which requires considerable upfront funding for no certainty of eventual success. In a recent paper in the Journal of Finance (2009), Why firms have so much cash, some co-authors found that there was “a dramatic increase from 1980 through 2006 in the average cash ratio for U.S. firms.” But interestingly, cash hoarding was not taking place among firms who instead paid high dividends to their shareholders. On the contrary, “we show that this increase is concentrated among firms that do not pay dividends, firms in more recent IPO listing cohorts, and firms in industries that experience the greatest increase in idiosyncratic volatility.”
The authors argue that the “main reasons for the increase in the cash ratio are that inventories have fallen, cash flow risk for firms has increased, capital expenditures have fallen, and R&D expenditures have increased.” In order to compete, companies increasingly must invest in new and untried technology rather than just increase investment in existing equipment. That’s riskier: “the greater importance of R&D relative to capital expenditures also has a permanent effect on the cash ratio. Because of lower asset tangibility, R&D investment opportunities are costlier to finance than capital using external capital expenditures. Consequently, greater R&D intensity relative to capital expenditures requires firms to hold a greater cash buffer against future shocks to internally generated cash flow.” So companies have to build up cash reserves as sinking fund to cover likely losses on research and development.
In the 1980s, average capital expenditures as a percentage of assets were more than double average R&D expenditures as a percentage of assets (8.9% vs.3.2%). In contrast, in the 2000s, R&D exceeds capital expenditures (6.7% vs.5.4%): “R&D intensive firms require a greater cash buffer against future shocks to internally generated cash flow. In contrast, capital expenditures are more likely to generate assets that can be used as collateral and hence are easier to finance. As a result, capital expenditures may mostly consume cash, which would be consistent with their negative relation with the cash ratio.” Rising cash is more a sign of perceived riskier investment than a sign of corporate health.
This story for America is also repeated for the UK. In a recent paper, Ben Broadbent from the Bank of England noted that UK companies were now setting very high hurdles for profitability before they would invest as they perceived that new investment was too risky (http://www.bankofengland.co.uk/publications/Documents/speeches/2012/speech581.pdf). Broadbent put it: “Yet on a recent Agency visit many companies told me that their hurdle rates of return had risen. Prior to the crisis finance directors would approve new investments that looked likely to pay for themselves (not including depreciation) over a period of six years – equivalent to an expected net rate of return of around 9%. Now, it seems, the payback period has shortened to around four years, a required net rate of return of 14%.” And remember that the current net rate of return on UK capital is well below that figure at about 11%.
UK corporate sector net return on capital (%)
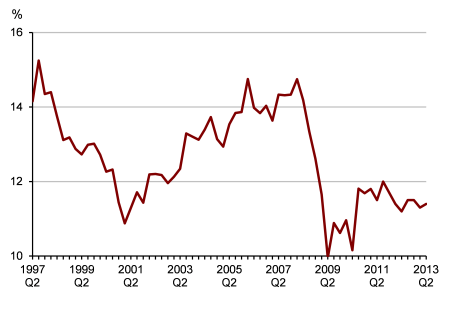
Broadbent continued: “the investments most vulnerable to such a shift – where you’d expect to find the sharpest increase in required returns – are those that have some element of irreversibility. This will include many projects (spending on intangibles, for example) that are necessary to improve productivity. Thus high risk premia may be inhibiting not just demand but the economy’s supply capacity as well… Even if the crisis originated in the banking system there is now a higher hurdle for risky investment – a rise in the perceived probability of an extremely bad economic outcome….In reality, many investments involve sunk costs. Big FDI projects, in-firm training, R&D, the adoption of new technologies, even simple managerial reorganisations – these are all things that can improve productivity but have risky returns and cannot be easily reversed after the event.”
And corporate debt remains an issue. Sure, interest rates on debt have fallen sharply over the last 25 years, so debt servicing costs should be down. But corporate debt levels have also risen in the same period, increasing the burden of risk on companies if there is any sign of a downturn in profitability. The latest data from the Bank of England (URL) confirm that, in aggregate, corporate debt in the major economies remains high. “Global debt levels increased rapidly before the global financial crisis. In the decade before 2007, non-financial sector debt to GDP ratios in advanced economies rose by an average of 40 percentage points. Since then, low interest rates have reduced borrowing costs and supported the values of financial and physical assets. Some borrowers have used this period to delever. But low interest rates have also encouraged some private sector borrowers to increase their debt levels. And government debt levels have increased materially. As a result, non-financial sector debt to GDP ratios in advanced economies have risen since 2007, by 55 percentage points on average.”

This increase in debt means that companies must raise profitability or be forced to reduce investment in productive capacity to service rising debt. The private sector in the major economies has been trying to ‘delever’, reduce its debt burden, at the expense of spending more (households) or investing more (companies). Which economy has done better relatively at deleveraging and better at more investment? From the graph above, the BoE explains: “deleveraging in the United States has occurred more quickly than in Europe. Since 2007, the US household debt to GDP ratio has fallen by 15 percentage points, to less than 80%. And while the US PNFC debt to GDP ratio has risen, it remains lower than in most other advanced economies.”
The UK private sector has not been so successful at reducing its debt burden. Strip out the government sector and the UK has the highest private sector debt ratio (and this does not include the banks), although that is mainly due to its very high household debt ratio.

Indeed, even in the US things are not looking quite so rosy. If we compare the level of cash reserves to overall corporate debt in the US, while it is at still at high levels compared to 15 years ago, the ratio of cash to debt is falling steadily.

So profitability of capital has got to be high enough both to justify riskier hi-tech investment and to cover a much higher debt burden (even if current servicing costs are low). So firms are not going to borrow more to invest even if banks are willing to lend. And if profitability is not high enough, then the level of investment incurred will follow as the graph on profits and investment among US non-financiaia firms shows.

Of course, small companies have neither cash reserves nor banks willing to lend to them at sustainable rates. So they are not investing in new equipment etc at all. Indeed, as I have noted before in previous posts, there thousands of heavily indebted SMEs which are barely keeping their heads above water despite low interest rates (UK lending to SMEs). According to research by the ‘free market’ Adam Smith Institute, 108,000 so-called zombie businesses in the UK are only able to service the interest on their debt, preventing them from restructuring. In a way, this is holding back a recovery in overall profitability and new investment because “Zombie firms stop workers and money being redeployed to more productive uses, they prevent new, better firms entering the market, they undermine competitiveness, reduce productivity and slow the growth of the whole economy.” In other words, they slow ‘creative destruction’ of capital by the liquidation of the weak for the strong.
So there we have it: the capitalist sector of the major economies has been increasingly hoarding cash rather than investing over the last 20 years or so. It is not investing so much because profitability is perceived as being too low to justify investment in riskier hi-tech and R&D projects, and because there are better and safer returns to be had in buying shares, taking dividends or even just holding cash. Also many companies are still burdened by high debt even if the cost of servicing it remains low;the worry is that if interest rates rise or companies take on more debt, it will become unserviceable.
The capitalist sector is not investing in sufficient new productive capacity to engender much higher employment and pre-crisis trend growth. And the alternative of public investment is shunned. Public investment in the US is at its lowest level since 1945. Gross capital investment by the public sector has dropped to just 3.6 per cent of US output compared with a postwar average of 5 per cent.

According to research by the Adam Smith Institute, a Westminster think tank, 108,000 so-called zombie businesses across the country are only able to service the interest on their debt, preventing them from restructuring.
The authors suggest that the perseverance of such companies goes some distance to explain the UK’s productivity puzzle: despite a considerable increase in hours worked in recent years, output has risen at a much more sluggish pace.
The report shows that corporate insolvencies have now fallen some way below their long-term trend. During the past 25 years, 1.2 per cent of businesses failed annually on average, but despite a weakened economy, the corporate failure rate has dipped to only 0.7 per cent in the past year.
According to Tom Papworth, who authored the report such a situation may delay the UK’s recovery.
“Zombie firms stop workers and money being redeployed to more productive uses, they prevent new, better firms entering the market, they undermine competitiveness, reduce productivity and slow the growth of the whole economy.”
He concluded: “With timely interventions by knowledgeable entrepreneurs, many firms can be restructured and saved.”
The report suggests that capital regulations make banks reluctant to foreclose on debtors and mark down their loss, since it would worsen their balance sheets.
Taking evidence from Japan’s lost decade, the author suggests that continued lending to otherwise insolvent firms can deprive more productive enterprises of resources.
Research by the Institute for Fiscal Studies published in February this year also suggested that capital misallocation could be part of the UK’s productivity problem.
– See more at: http://www.cityam.com/article/1384755193/uk-s-zombie-firms-taking-bite-out-productivity#sthash.i6WpHXPG.dpu

Interesting article, as always, although I’m a little confused as to how this analysis accords with your argument regarding the profit rate as explaining a secular and cyclical decline in capitalism. Isn’t the above post arguing instead that firms have simply lost their entrepreneurial spirit?, albeit partly due to indebtedness and the expansion of the financial sector. To put it another way, what if these firms had invested in R&D, and creative destruction had been allowed to take its course: could this have ameliorated the decline in the ROP?
Great stuff as usual and thanks for the reference to my recent look at the situation here in Canada. I particularly liked your discussion of how the changing importance of R&D impacts on profitability. I think there’s lots more there…also looking at how the same processes affect the organization of labour and value extraction.
I’m doing a follow-up to my post on profit and investment in Canada that takes some cues from your recent look at Keynesian/Marxian explanations on the “permanent slump” hypothesis.
Same is very much true in New Zealand. The Employment Contracts Act of 1991 codified the defeat of the union movement and afterwards the employers relied more and more on making workers work harder, faster and longer (NZ has among longest working hours in OECD), rather than investing in PME (plant, machinery, equipment), let alone R&D. Indeed, most R&D here is done in the public sector (by crown institutes, universities etc).
A substantial productivity gap opened up between Australia and NZ in the 1990s. it’s interesting looking at graphs of the 1980s (when annual productivity was increasing by similar percentages in eacgh country) to post 1991, when NZ falls very noticeably behind.
In recent years there has been a shift in economic orthodoxy here, away from unbridled neo-liberalism, because the more clued-up sections of the ruling class know they can’t just keep on like this. At the same time, in a system which operates beyiond their control, they haven’t been able to apply a ‘fix’ either. Plenty of employers seem to just drift along not wanting to invest in expanding relative surplus-value.
Phil
Reblogueó esto en Alejandro Valle Baeza.
Interesting point here in the latest BIS quartly:
Over the past few months, monetary accommodation continued to drive financial markets. In major advanced economies, bonds and stocks shrugged off the summer sell-off and posted gains on the view that low policy rates and large-scale asset purchases would persist over the medium term. Thus, markets took in their stride a
two-week US government shutdown and uncertainty over a US technical default. By contrast, country-specific strains weighed on several large emerging market economies, preventing a full recovery of local asset valuations and capital flows.
From a longer-term perspective, recent developments confirmed a trend benefiting large corporate borrowers with direct access to credit markets. Since mid-2012, low interest rates on benchmark bonds have driven investors to search for yield by extending credit on progressively looser terms to firms in the riskier part of the spectrum. This investment strategy, which has squeezed credit spreads, has so far been supported by low default rates on corporate bonds.
The credit environment has benefited large non-financial corporates more than banks domiciled in advanced economies. Struggling to regain markets’ confidence during the past five years, these banks have consistently faced higher borrowing costs than non-financial corporates with a similar credit rating. While the cost gap narrowed more recently, especially in the United States, it continued to exert upward pressure on bank lending rates. This prompted large non-financial firms to resort directly to debt markets, thus spurring corporate bond issuance. As a result,
markets eclipsed banks as a source of new credit to corporates in the euro area.
Click to access r_qt1312.pdf
So, for the moment NFC are able to refinance debt through cheap credit on the markets as interest rates remain low. But in the meantime profitability remains low too.