Every year, I refer to the Credit Suisse Global Wealth Report 2018 for an update on the level of inequality of household wealth globally. Last year, the bank’s economists found that top 1% of personal wealth holders globally had over 50% of the world’s personal wealth – up from 45% ten years ago. In the US, the three richest people in the US – Bill Gates, Jeff Bezos and Warren Buffett – own as much wealth as the bottom half of the US population, or 160 million people.
This year’s report showed some interesting variations. In the report, personal wealth is measured by the value of property and financial assets after deducting any debt held by adults. During the 12 months to mid-2018, aggregate global wealth rose by $14 trillion to $317 trillion, representing a growth rate of 4.6%. This was sufficient to outpace population growth, so that wealth per adult grew by 3.2%, raising the global mean average wealth to $63,100 per adult, a record high (but remember this in nominal dollar terms, before inflation).
Switzerland (USD 530,240), Australia (USD 411,060) and the United States (USD 403,970) again head the league table according to wealth per adult. The ranking by median average wealth per adult favours countries with lower levels of wealth inequality and produces a slightly different table. This year, Australia (USD 191,450) edged ahead of Switzerland (USD 183,340) into first place. So Australia has the highest median wealth per adult in the world.
As the reports says, top wealth holders benefit most from the rise in financial wealth (stocks, bonds, cash etc), leading to rising wealth inequality in all parts of the world. In contrast, since the end of the Great Recession, median wealth has not risen and in many places declined.
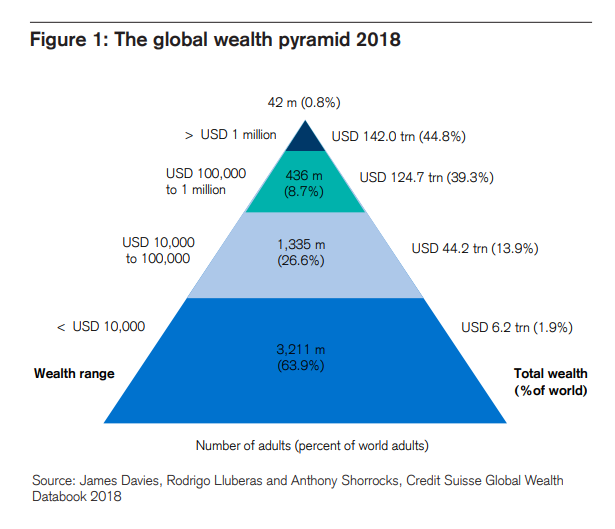
In the last 12 months, however, wealth inequality has stabilised. There are 3.2 billion adults with wealth below $10,000. So 64% of all adults have just 1.9% of global wealth. In contrast, 42 million millionaires, comprising less than 1% of the adult population own 45% of household wealth. China is now firmly established in second place with respect to the number of dollar millionaires (behind the United States and above Japan) and in second place also (above Germany) with respect to the number of ultra-high net worth individuals.
In the global wealth pyramid, there are 3.2m adults (64%) with just 1.9% of global wealth; another 1.3bn adults (27%) with 14% of global personal wealth; and 430m (about 9%) with 39%. That leaves at the top, just 42m (0.8%) with a massive 45%. About 30% of adults in so-called rich countries are in the bottom layer – due to business losses or unemployment, for example or a life-cycle phase associated with youth or old age. In contrast, more than 90% of the adult population in India and Africa falls into this category. In some low-income countries in Africa, the percentage of the population in this wealth group is close to 100%!
$10,000–100,000 is the mid-range band in the global wealth pyramid, covering 1.3 billion adults and encompassing a high proportion of the so-called ’middle class’ in many countries. The average wealth of this group is sizable at $33,100. This sector has grown by a staggering 300m in the last year and there is one explanation for that: China (with 48% of this segment). The huge growth in real GDP and living standards has allowed hundreds of millions of Chinese to accumulate a modicum of personal wealth – but nowhere else. “The contrast between the number residing in China (641 million, 59% of Chinese adults) and India (73 million, 8.6% of Indian adults) is particularly striking.”
The top tiers of the wealth pyramid – covering individuals with net worth above $100,000 – comprise just 9.5% of all adults. So if you have $100,000 or more in property and financial assets (after debt), then you are in the top 10% of wealth holders globally. How is that possible? Because everybody below you, especially the bottom two-thirds, have no wealth to speak of at all.
This top 10% are concentrated in the so-called ‘global North’, with 79% of this group. Europe alone hosts 156 million members (33% of the total), roughly double the number in China (81 million). However, only five million members (1.1% of the global total) reside in India, and only three million (0.6%) in Africa.
The US has by far the greatest number of millionaires: 17.3 million or 41% of the world total. The number of millionaires in China has now overtaken the number in Japan and stands at 3.4 million (8.2% of the world total) compared to 2.8 million (6.6%) for Japan.

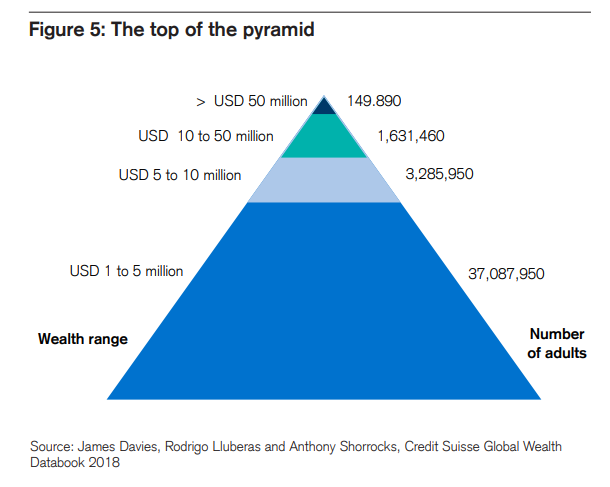
Then there are the super-rich. In mid-2018, the report estimates there are 42.0 million adults with wealth between USD 1 million and USD 50 million, of whom the vast majority (37.1 million) fall in the USD 1–5 million range. And there are just 149,890 adults worldwide with net worth above USD 50 million. Of these, 50,230 are worth at least $100 million, and 4,390 have net assets above $500 million. Most of these people are in the US. If China continues to expand, then the middle segment of wealth holders will expand too. But the number of ‘super-rich’ looks set to rise too over the next five years, to reach a new all-time high of 55 million.
At the bottom of the pyramid, the number of adults with wealth below $10,000 is expected to fall from 64% of the total to 61%, but this is mainly because of the rise in inflation and China. Around two-thirds of the world’s adults remain basically without any personal wealth worth speaking of. So no change there.

Thanks for reminding me it is out. Always an insightful report. Yup its less than 2 million capitalist families (worth +USD10 million) vs 1.85 billion waged workers (ILO data).
The Climate Conference is currently taking place and can not find a way out. A mode of production whose primary purpose is to produce value and accumulate wealth for a few is necessarily disinterested, even ruthless toward man and nature.
The abandonment of the luxury production of the super-rich and the abandonment of the luxury of armaments and space flights alone would reduce production and harmful emissions by at least 30%.
without the living conditions of wage earners worsening.
I saw a report in Bloomberg by Ned Davis Research. All US asset classes have turned down in 2018 and that was before today and yesterday’s routs on the stock markets. Here is the important detail. The last time this happened was in 1972, at the end of the post-war boom. Similarly, are we seeing the end of the current era of globalisation that extended for 25 years too. If so this is momentous and if true, the top 1% are going to be a lot less rich. Next year’s Credit Suisse report looks like it is going to look a lot different. Hurrah.
Before we start singing “Happy Days are Here Again,” take a look back and tell me exactly who made out better in the post 1972 era? The working class or the bourgeoisie? Always keep in mind that a rich man can get through poor times better than a poor man.
Now the movement of capital is independent of applause or condemnation. The mere fact of a downturn doesn’t mean there is going to be a resolution of benefit to human beings. Look at 2008-2009
>Now remove the primary real estate (the house where you live) from this study.
>Real wealth in capitalism is financial wealth.
>Of course houses in central economies will be more expensive.
>Someone thinking that is rich because has a house is a deluded.