The final figures for US real GDP in the second quarter of this year (April to June) were released at the end of last week. They showed that the US economy was growing at an annual rate of nearly 4% (3.9%) in the summer after yet another poor first (winter) quarter of just 0.6% growth. So, compared to summer 2014, the US economy has expanded by 2.7%. Indeed, the US economy has been growing at that sort of rate for the last four quarters.
However, before the cry comes that, finally, American capitalism is back on a sustained trend in growth similar to that before the Great Recession, there are some caviats.
First, the growth in gross domestic income (as opposed to product) is much slower. GDI slowed to just 2.1% yoy in Q2 2015. Gross domestic income is the income received by American homes and businesses. If gross domestic product grows more, it means more of the value of that domestic production has gone to foreign businesses and abroad.
Second, the reason that GDP growth seems to have picked up in the second quarter is that for virtually the first time since the Great Recession, the government sector expanded. In Q2, America’s states (not the federal government) contributed 12% towards US economic growth, instead of reducing it, as healthcare spending rose.
Also, although business investment rose, it contributed a relatively smaller proportion towards GDP growth (20%) compared to previous quarters and years since the end of the Great Recession. Growth was mainly achieved by households buying more cars, electrical goods and spending more on healthcare (Obama-care?) and taking out mortgages to buy more homes. US growth is consumer-driven and debt-financed (with interest rates at all-time lows).
But the most sobering caveat is that in the current quarter (Q3) just ending this week, US real GDP growth looks likely to have slowed down sharply from that near 4% rate to something close to 2%. Indeed, the Atlanta Federal Reserve real GDP forecasting indicator, which has been very accurate in the recent years, forecasts just a 1.4% growth rate for Q3.
And the forecast slowdown is not really surprising because economic data in this current quarter has been very weak: factory orders, retail sales, durable goods orders, industrial production etc.
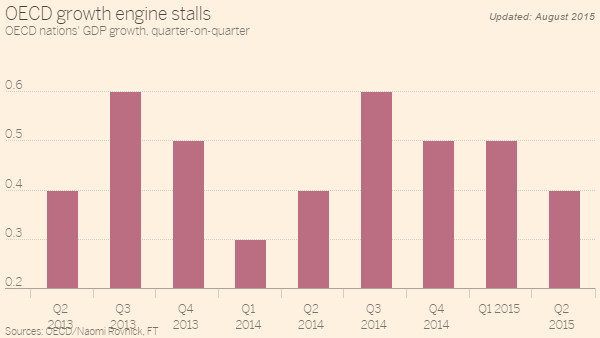
Alongside this US slowdown, the major capitalist economies, both advanced and so-called ‘emerging’, have been slowing. According to the OECD, economic growth in the 34 major advanced capitalist economies grew by only 0.4% in the second quarter of 2015 from the first quarter – a deceleration from the 0.5 per cent quarter-on-quarter growth achieved in the first three months of this year. Year-on-year GDP growth for the OECD area remained unchanged at 2 per cent in the second quarter of 2015.
And in this quarter of the year, global growth seems to have slowed even more. The UK economy, which was the leader in the top G7 economies, may struggle to achieve 2% growth, while Germany, France, Japan and Italy will be closer to 1%. And the major ‘emerging’ economies are diving. We have all heard about China slowing fast, leading to slowdowns in Australia, New Zealand and most of south-east Asia.
But on top of the ‘China crisis’, there are outright slumps in Brazil and Russia and low growth in Turkey, South Africa and Indonesia. Even India’s real GDP growth, which has been racing along at about 7% a year, turned down this quarter. The global crawl is turning paralytic.
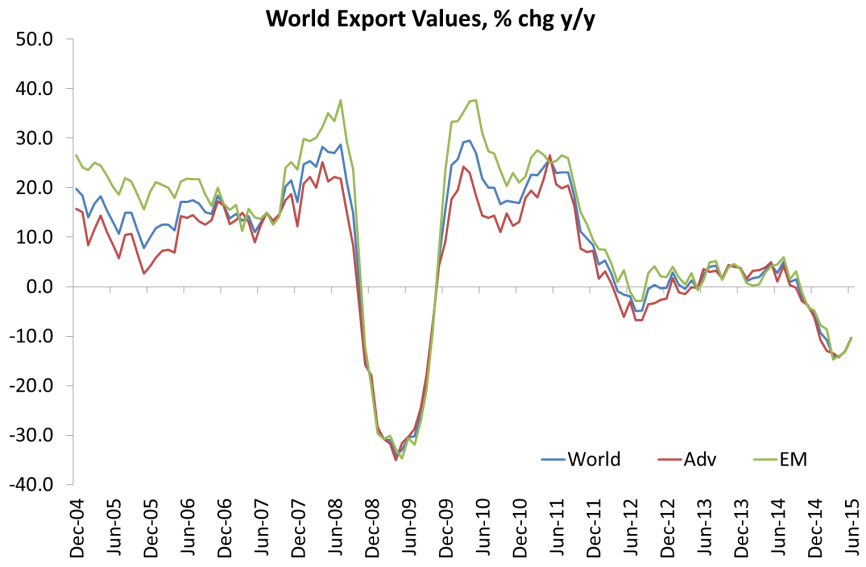
World trade is heading back to the depths of the Great Recession.
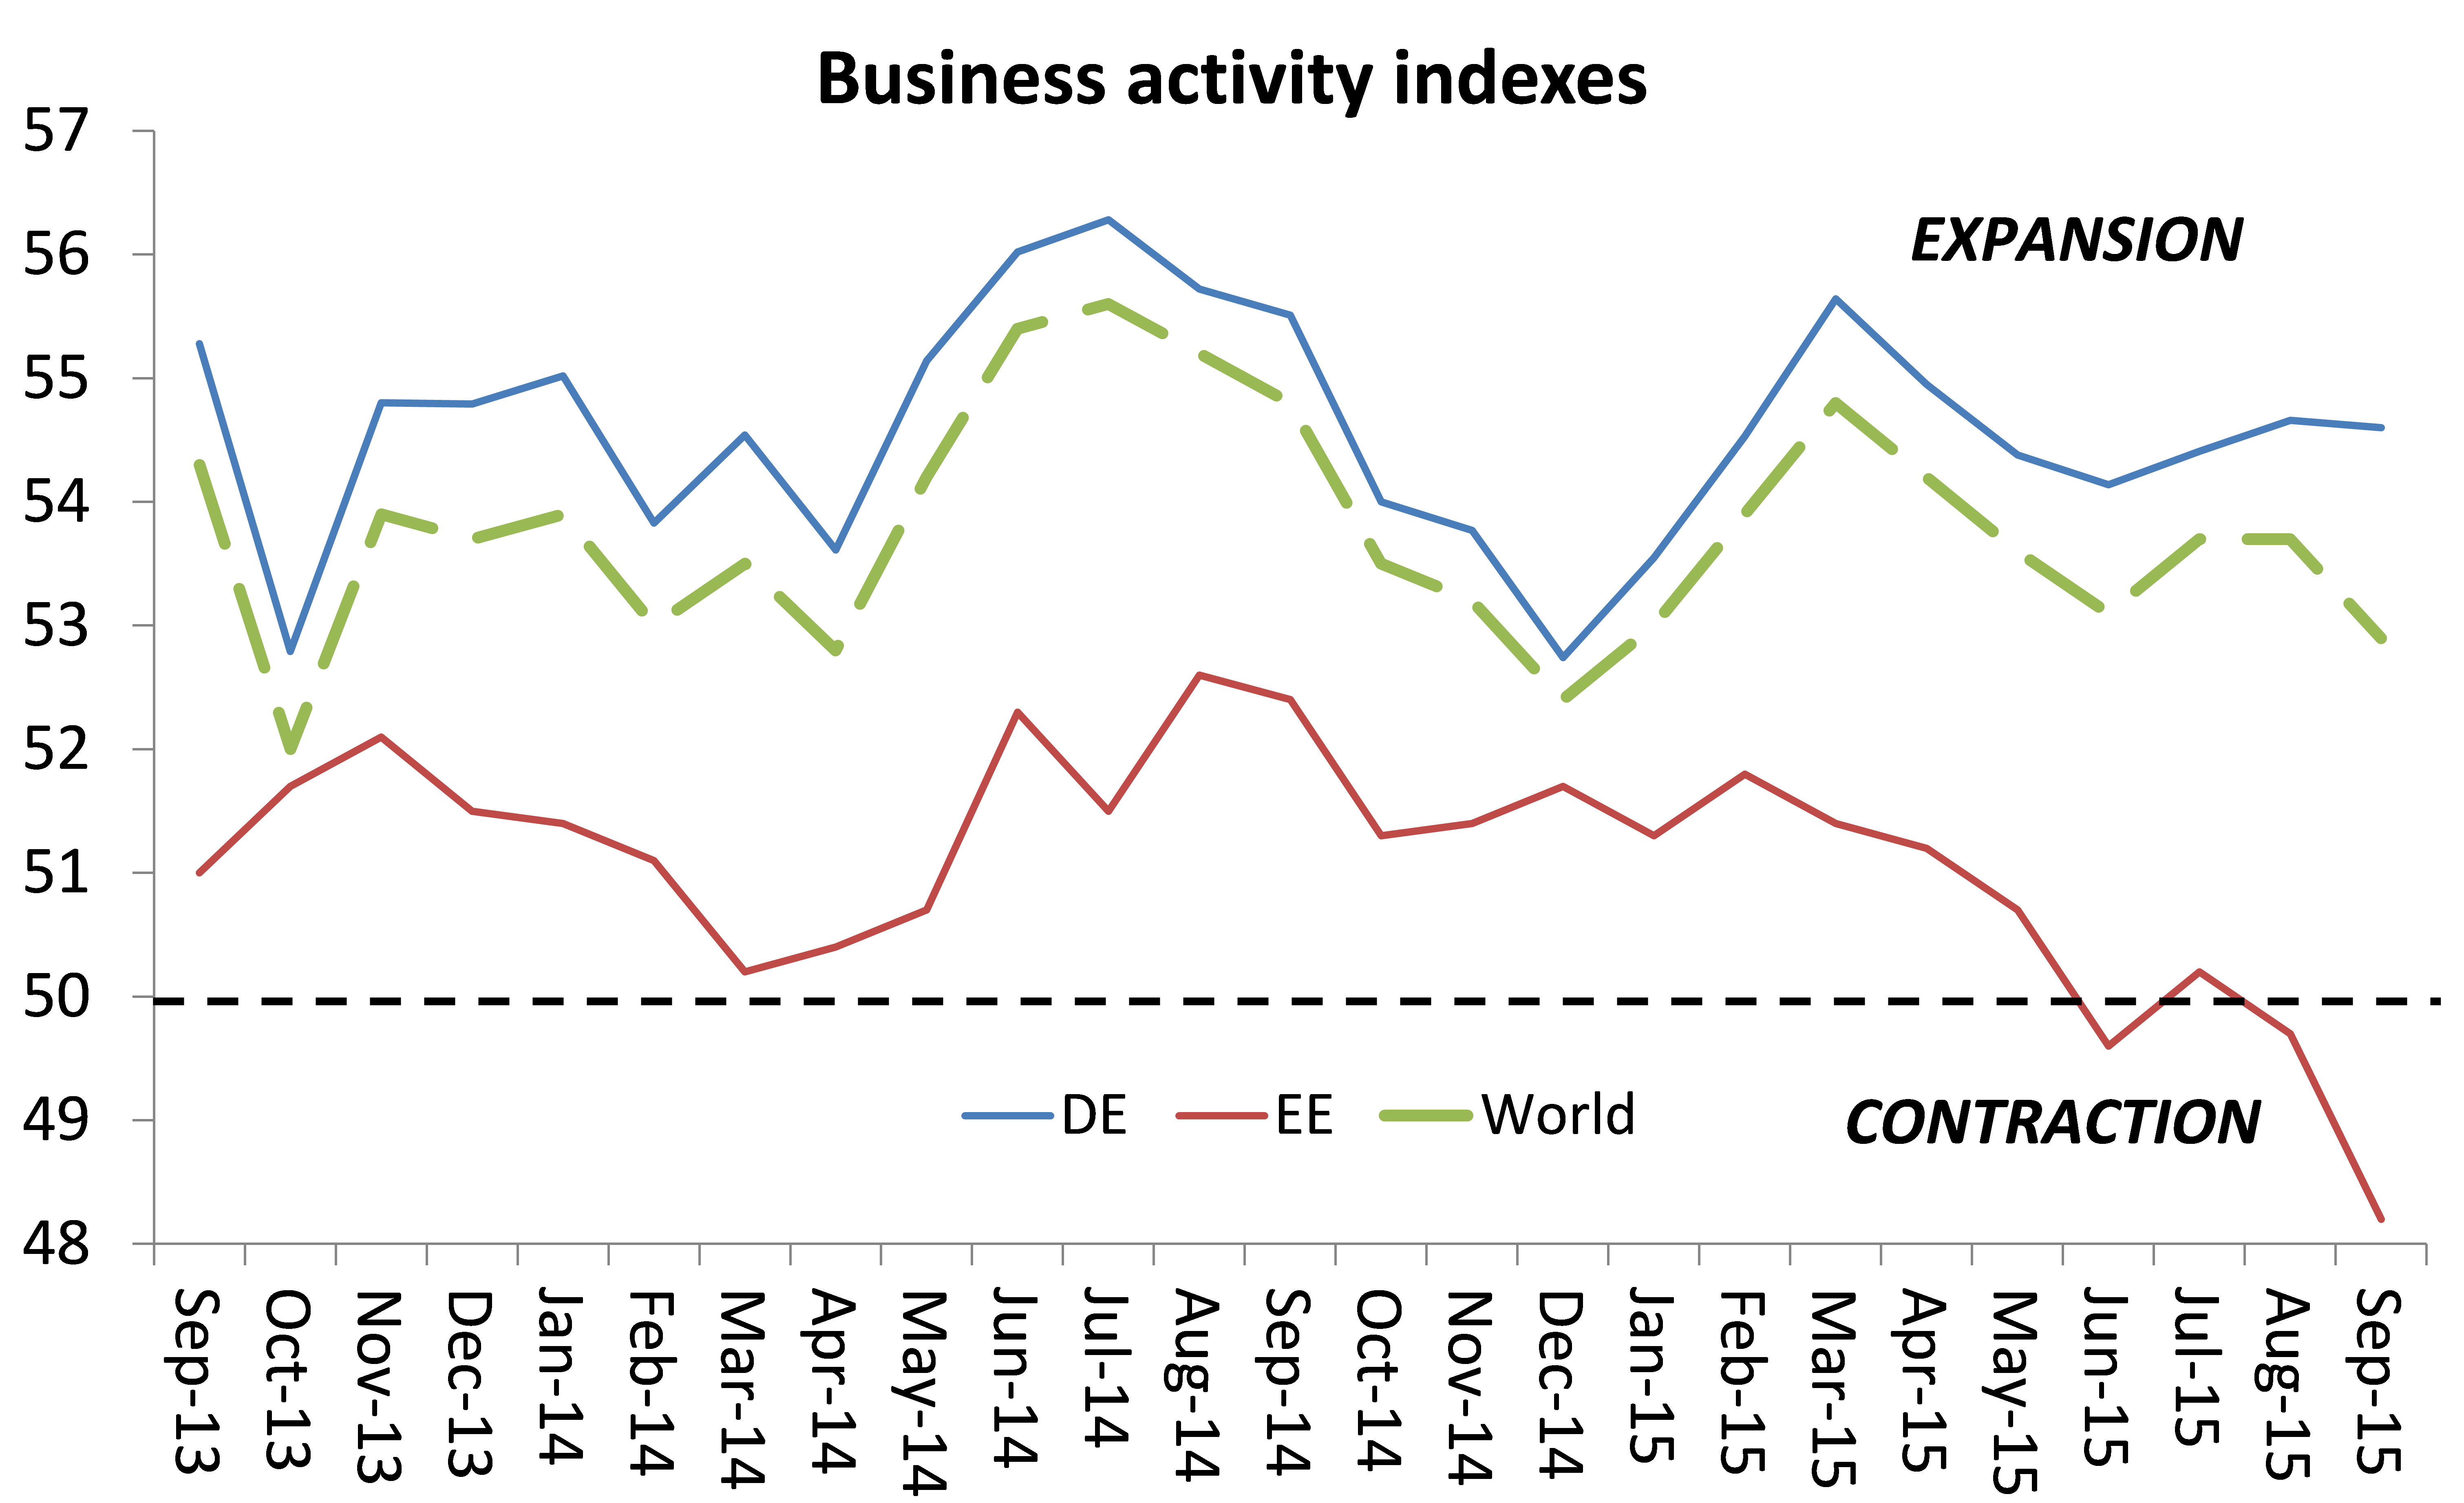
Indeed, the latest update of my global business activity index (based on purchasing managers indexes around the world), shows a sharp contraction in activity among emerging markets.
So it is no wonder that the US Federal Reserve drew back from its planned hike in interest rates in September. The Fed statement specifically highlighted the global economic slowdown as the reason for holding off (at least until December). The Fed, along with many mainstream economists, that hiking US rates would spill over into higher cost of borrowing and debt servicing and possibly trigger a collapse in stock and bond markets globally – something I have highlighted before as another ‘1937’.
Several financial strategists are already worried that stock markets are overvalued compared to future earnings and profits. And that’s what the ‘Warren Buffet’ indicator of the value of corporate stock to GDP shows – significant over-valuation.
That’s where the latest data on corporate profits come in. In Q2 2015, US corporate profits, after taking into account inventories and depreciation (in other words, new profits), rose just 0.6% compared with summer 2014 and, after tax, actually fell 0.6%.
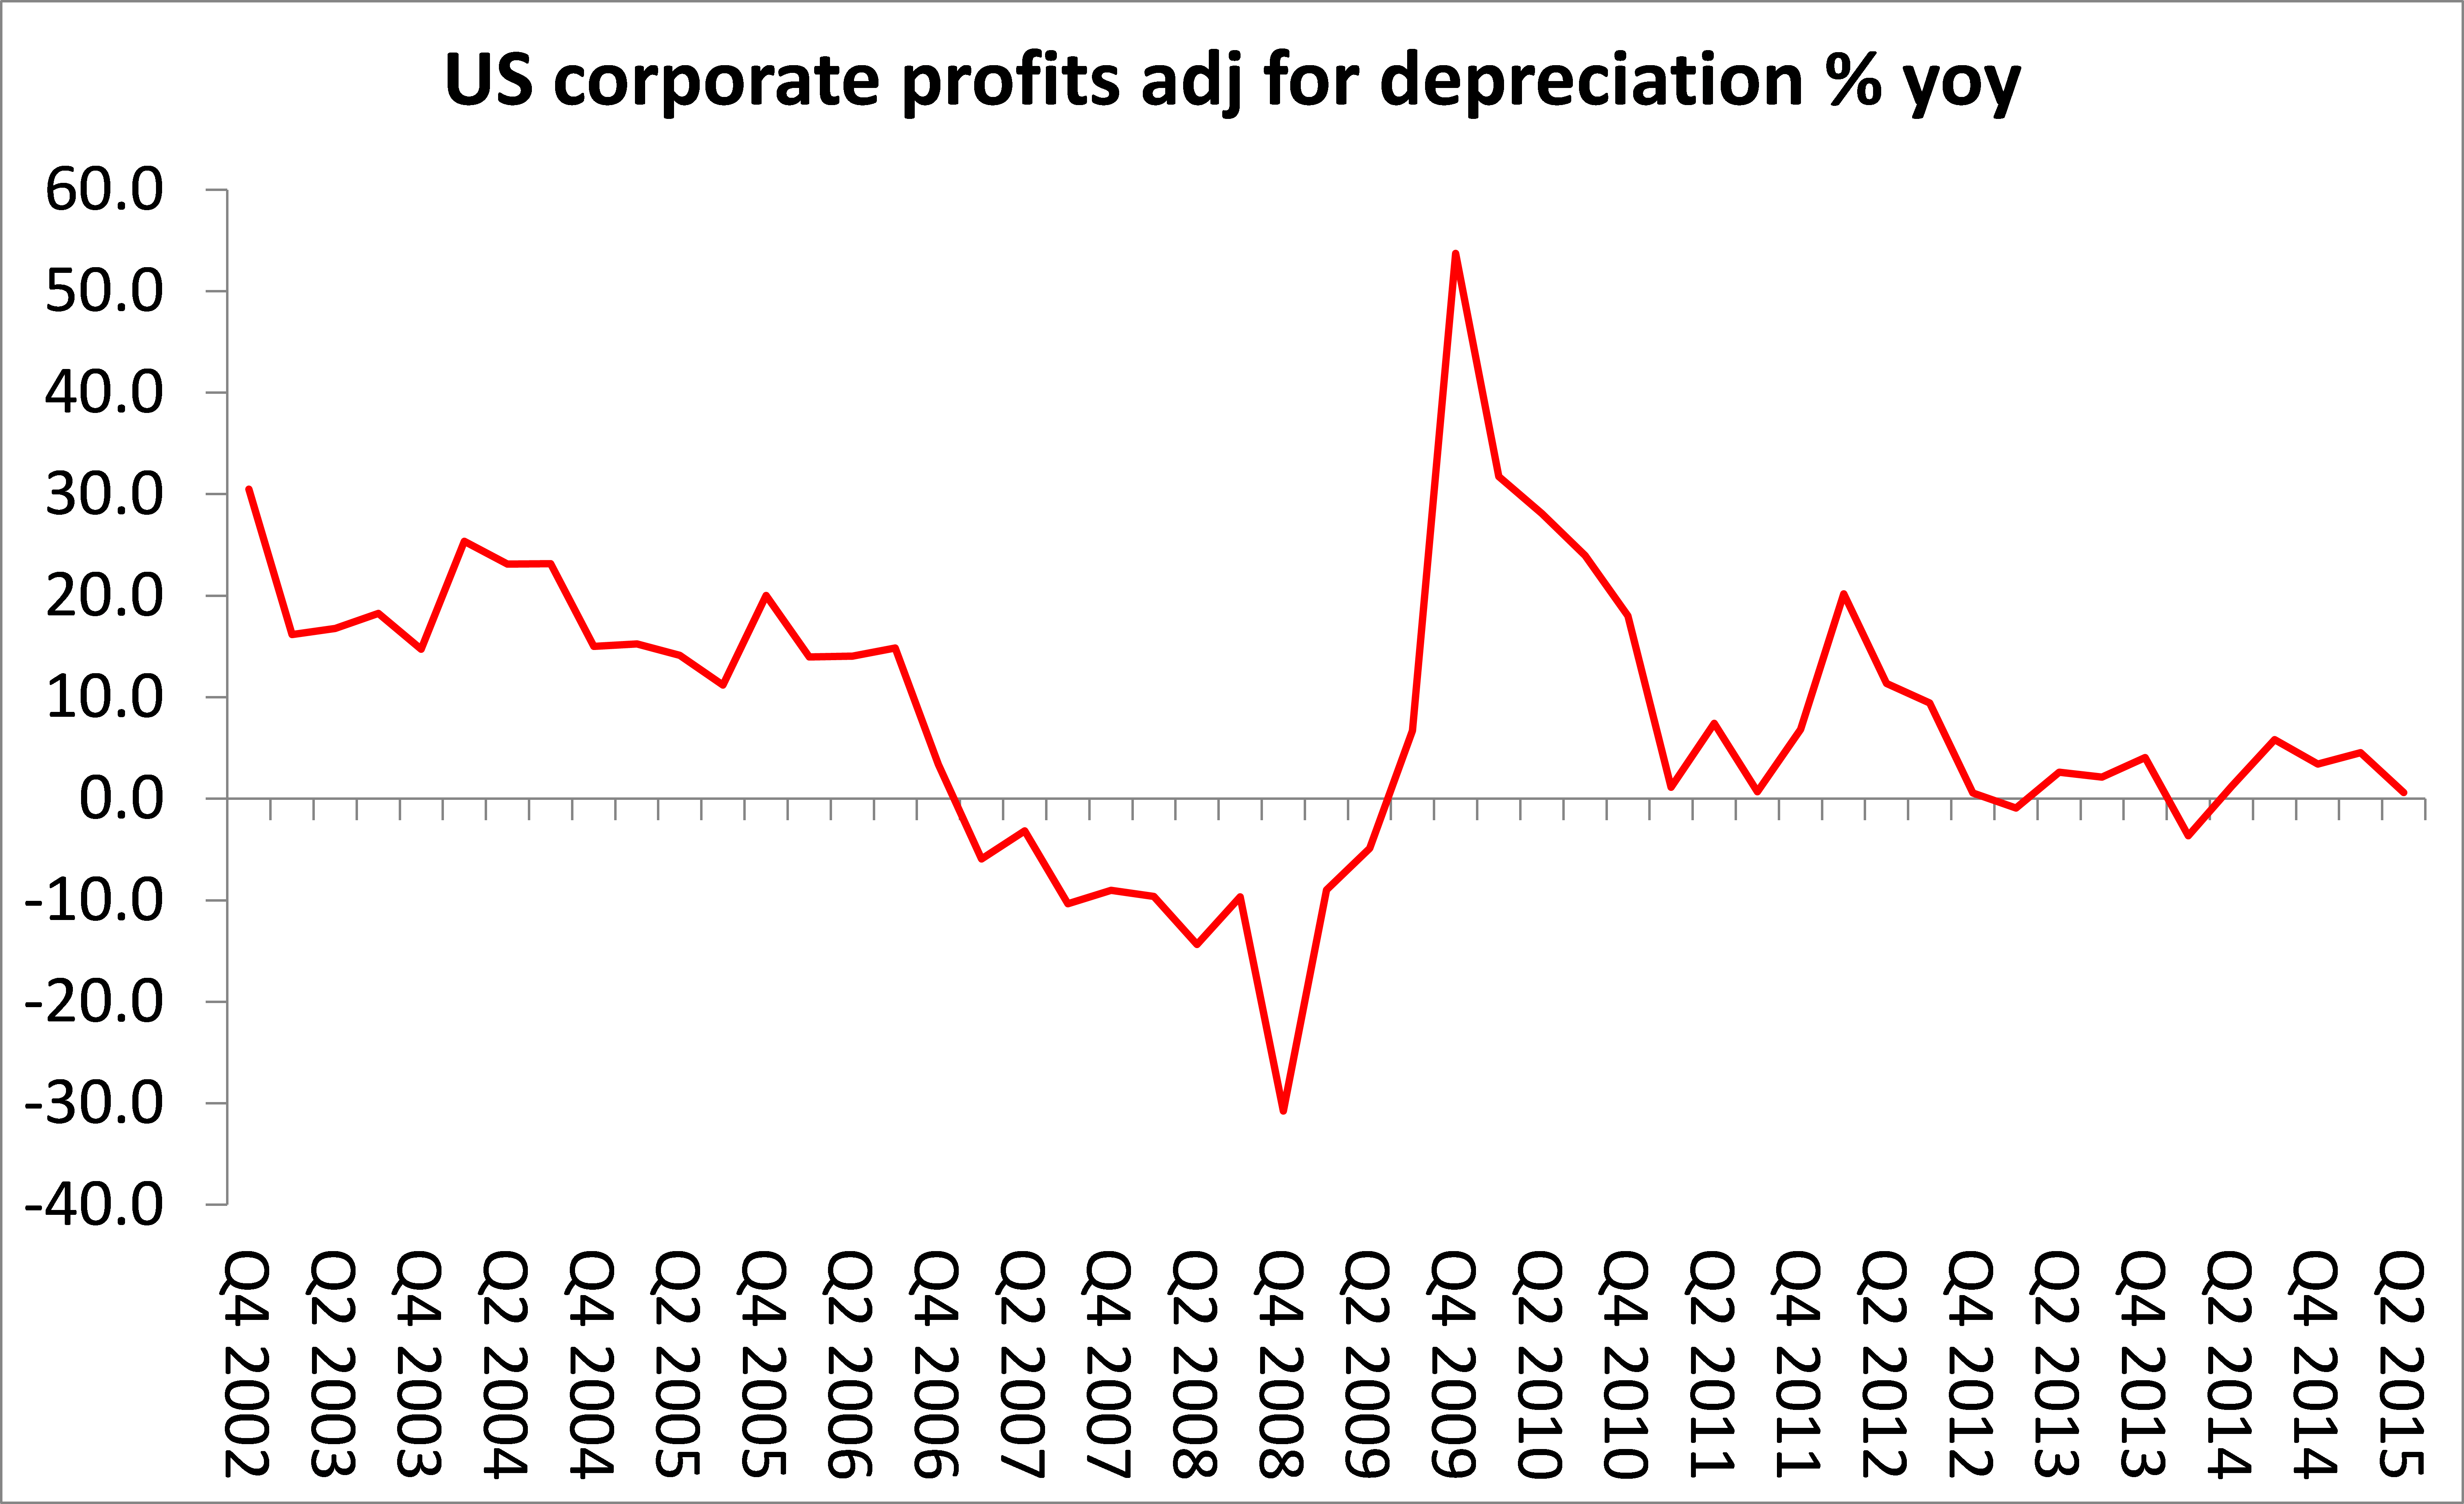
And there was a sharp increase in dividends paid out to shareholders by corporations. So the available profit for investment has dropped 4.6% compared to summer 2014. Moreover, two-thirds of the rise in profits in Q2 2015 accrued to the financial sector with just one-third to productive sectors.
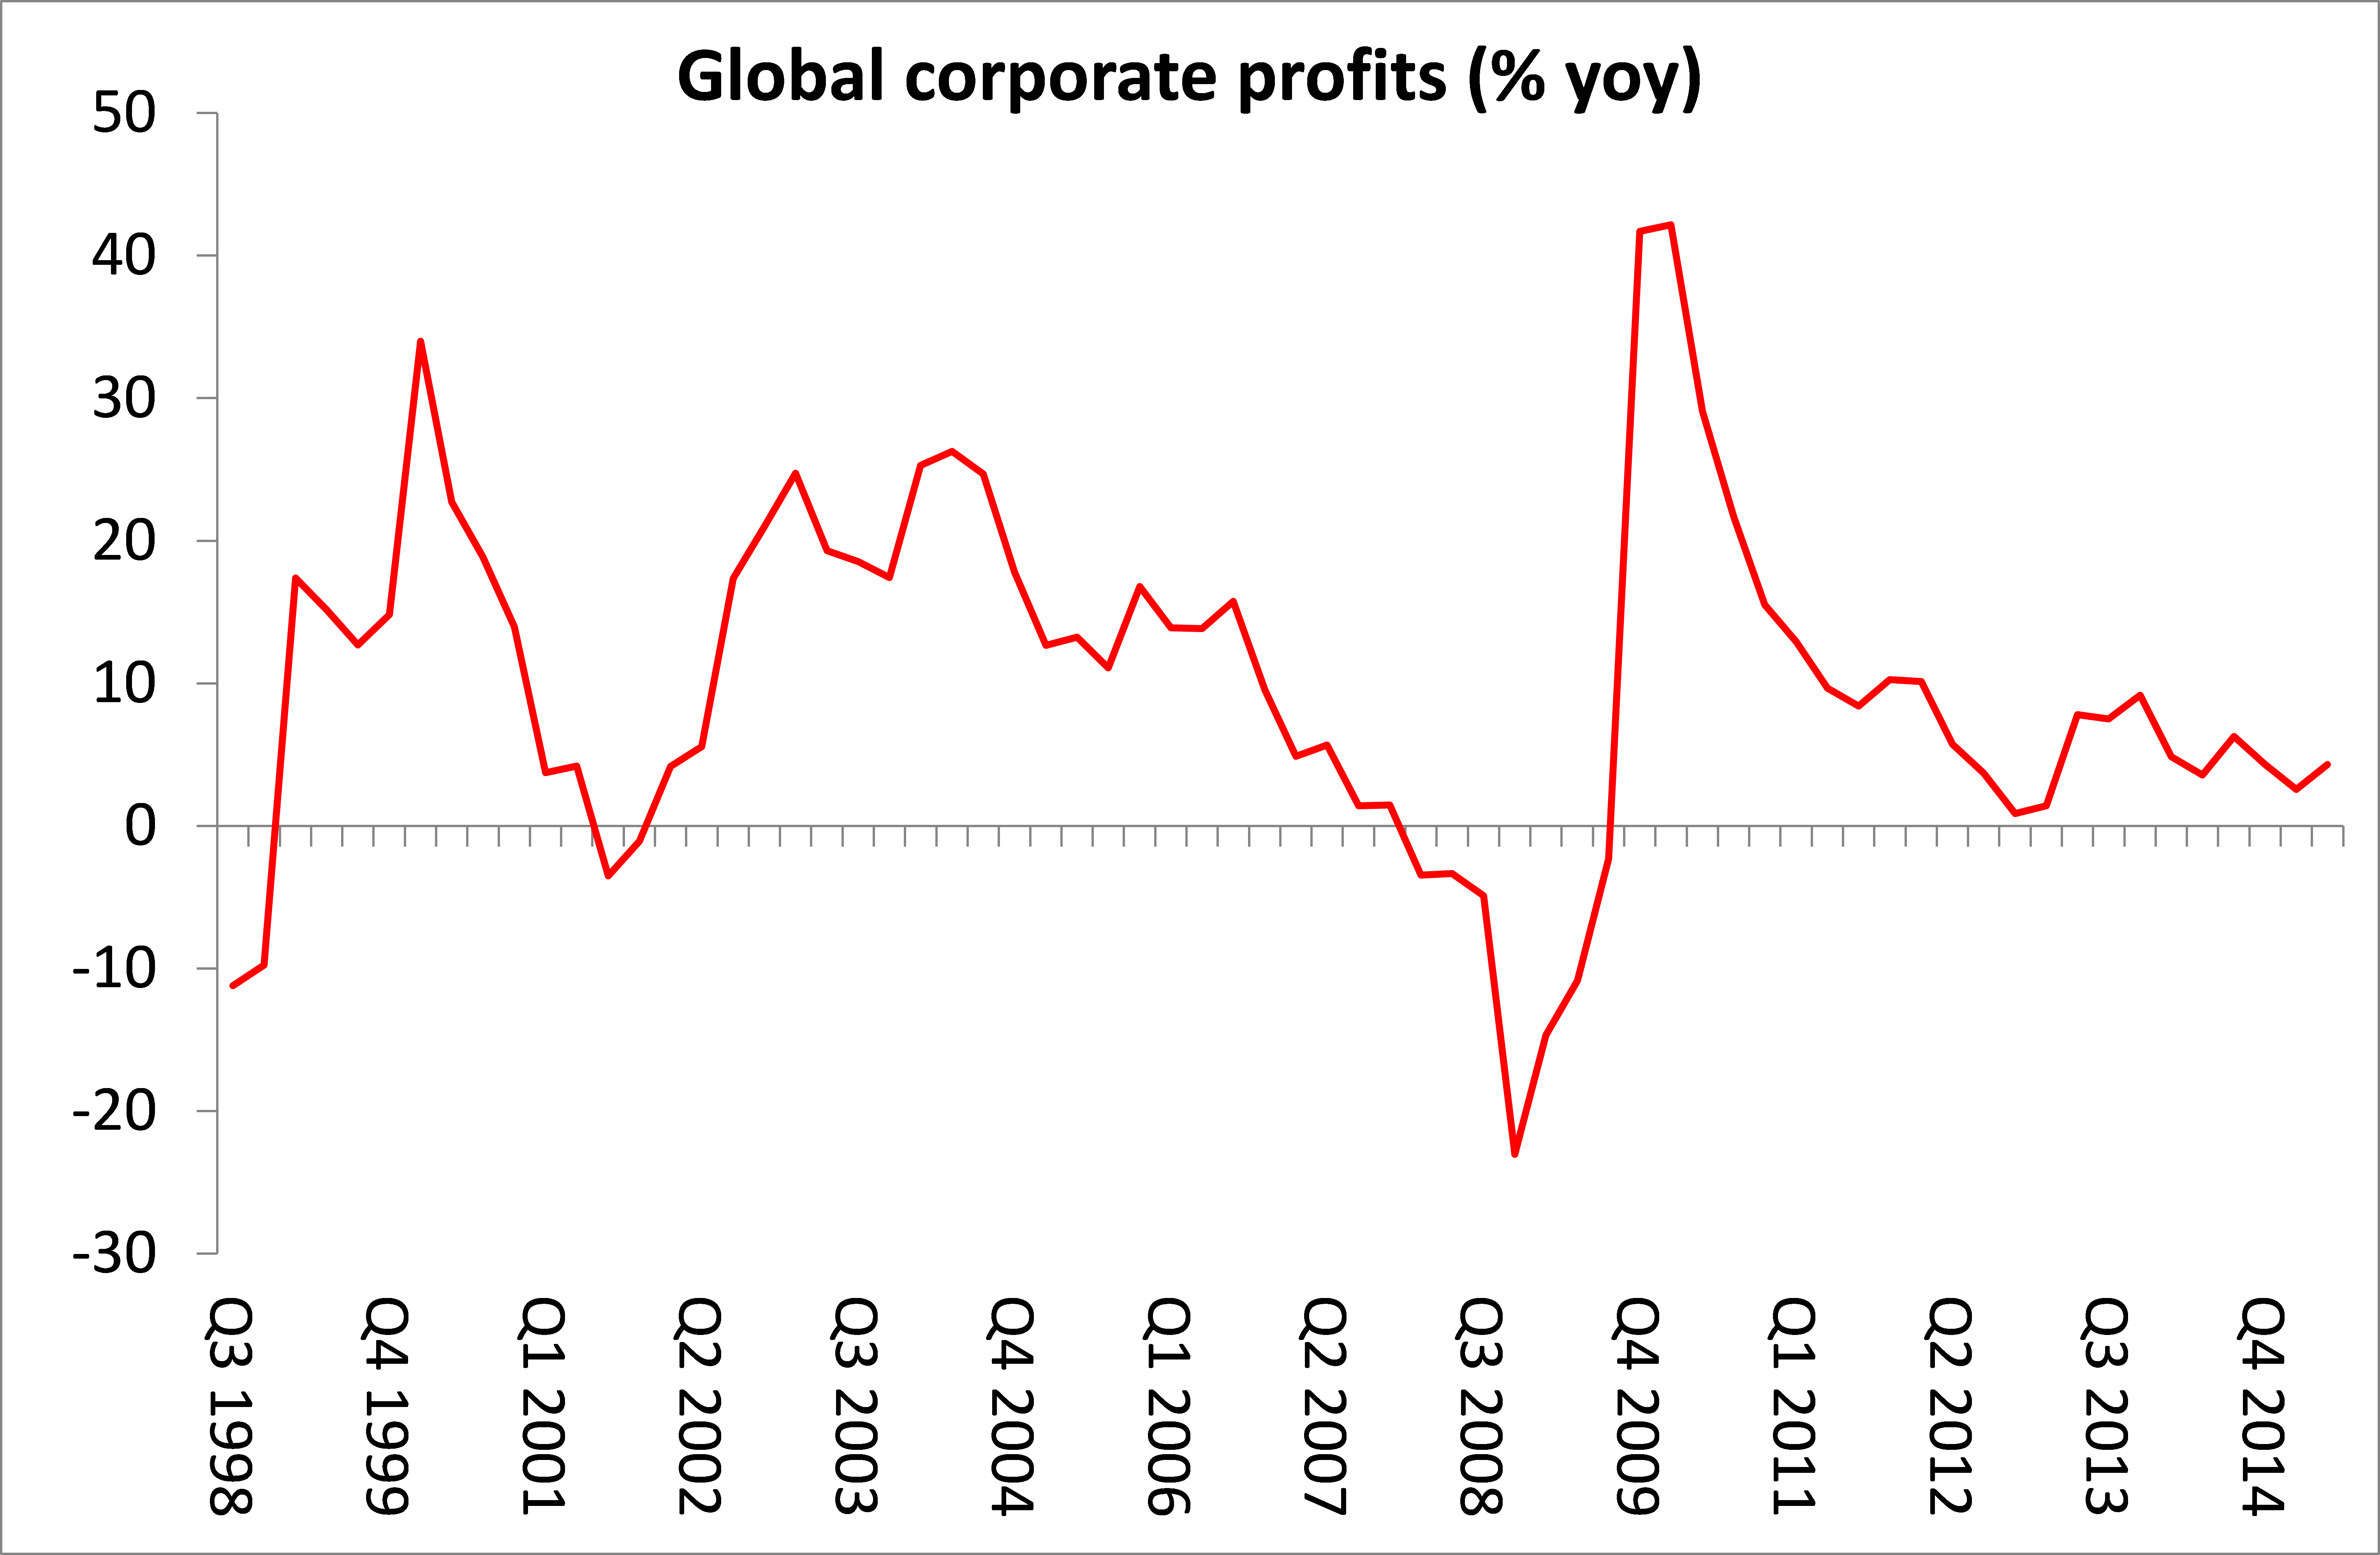
Globally too, corporate profit growth remains low. Indeed, without a sharp rise in Japanese corporate profits in Q2, growth would have been a trickle. Indeed, Chinese industrial profits fell nearly 9% in August compared to August 2014.
Looking out longer term, a new report from the management consultant, McKinsey (MGI Global Competition_Executive Summary_Sep 2015) reckons that “the world’s biggest corporations have been riding a three-decade wave of profit growth, market expansion, and declining costs. Yet this unprecedented run may be coming to an end”. According to McKinsey, the global corporate-profit pool, which currently stands at almost 10% of world GDP, could shrink to less than 8% by 2025—undoing in a single decade nearly all of the corporate gains achieved relative to the world economy during the past 30 years.
From 1980 to 2013, vast markets opened around the world while corporate-tax rates, borrowing costs, and the price of labour, equipment, and technology all fell. The net profits posted by the world’s largest companies more than tripled in real terms from $2 trillion in 1980 to $7.2 trillion by 2013, pushing corporate profits as a share of global GDP from 7.6% to almost 10%.
But McKinsey reckons that profit growth is coming under pressure. This could cause the real-growth rate for the corporate-profit pool to fall from around 5% to 1%, practically the same share as in 1980, before the boom began. So the great neo-liberal period of corporate profit recovery is over. According to McKinsey, margins are being squeezed in capital-intensive industries, where operational efficiency has become critical. Meanwhile, some of the external factors that helped to drive profit growth in the past three decades, such as global labour arbitrage (globalisation) and falling interest rates, are reaching their limits.
As I have argued on many occasions, from the movement in profits flows the movement in investment and then to overall economic growth. If profits, both globally and in the US, start to fall, then eventually so will investment and the slow economic growth recorded in the major capitalist economies since 2009 could turn into a new slump.
Economic recessions or slumps seem to occur about every 8-10 years in the post 1945 period (1958-60, 1970, 1974-5, 1980-2, 1990-2, 2001, 2008-9), the so-called business cycle. If that cycle is to reoccur, then the next recession is due between 2016 and 2018 (given that the last began in 2008).
I have argued that we can discern a profit cycle as well as a business cycle (see my book, The Great Recession). The cycle of profitability is about 32-36 years, trough to trough, in the US. The last trough was in 1982, followed by the so-called neoliberal revival in profitability until 1997-00. The current downwave should therefore trough no later than 2018. If this is right – any scientific analysis worth its salt should make predictions that can be proved wrong (or right) – then profitability in the US should be heading downwards pretty soon. All this suggests a major slump within 1-3 years.
The world economy is still crawling along, but interest rates are at all-time lows and stock markets are way overvalued. Any shift up in the cost of borrowing and any shift down in profitability would turn that crawl into crash.

“Growth was achieved by households … spending more on healthcare (Obama-care?)…”
Yes. See http://mrzine.monthlyreview.org/2015/andrews290415.html
Reblogged this on Econo Marx 21.
“The cycle of profitability is about 32-36 years, trough to trough, in the US. The last trough was in 1982, followed by the so-called neoliberal revival in profitability until 1997-00. The current downwave should therefore trough no later than 2018. If this is right – any scientific analysis worth its salt should make predictions that can be proved wrong (or right) – then The cycle of profitability is about 32-36 years, trough to trough, in the US. The last trough was in 1982, followed by the so-called neoliberal revival in profitability until 1997-00. The current downwave should therefore trough no later than 2018. If this is right – any scientific analysis worth its salt should make predictions that can be proved wrong (or right) – then profitability in the US should be heading downwards pretty soon. All this suggests a major slump within 1-3 years.
If the previous trough was in 1982, followed by a rise until a peak in 1997, doesn’t that mean that on the basis of your hypothesis, profits were then falling for 18 years, giving the next trough, as you say around 2015-18.
If then the trough for profits already occurred, on your basis in 2015, or will arrive by 2018, does that not mean that you should be arguing that we are now set for an 18 year upswing in profitability???
If you argue that the trough, as opposed to the peak is due in 2018, how on Earth can you simultaneously argue that “profitability in the US should be heading downwards pretty soon”. Surely, any “scientific analysis worth its salt should make predictions that” if profitability troughs in 2018, it should then be in for an 18 year secular rise, similar to the secular rise you have claimed between 1982-97.
In that case, if you are going to claim that investment is determined by this profit cycle, you should be arguing that this secular rise in profits will cause a secular rise in investment spending, which will lead not to a slump, but a new powerful boom.
There are dialectical contradictions, based on the contradictory nature of reality, and there are contradictions, which are just two completely excluding statements, and the contradiction in your argument seems to be of the latter kind rather than the former.
In fact, the rise in the rate of profit, didn’t start until around 1987. The period from the late 1970’s, until 1987, were a classic example of Marx’s analysis in Capital, that the law of the Tendency for the Rate of Profit to Fall, is one of the means used to resolve crises of overproduction. Capital begins to invest in labour saving technology, so as to deal with the squeeze on realised profits, caused by high wages and labour shortages. The development of microchip technology during that period, was one means of doing that, and its implementation in the print industry, for example, demonstrates Marx’s analysis. It is the same as marx’s analysis in Value, Price and Profit, of how capital introduced labour saving technology in agricultural to counter labour shortages and high wages in the 1850’s, that resulted from the 1843-65 long wave boom.
This shift to intensive accumulation, then causes the organic composition of capital to rise, as more material is processed by a given quantity of labour, which creates the conditions for a falling rate of profit. But, this process, as Marx sets out results over a period, in the demand for labour thereby being reduced, which lowers wages, and it simultaneously reduces the value of constant capital.
New fixed capital has a lower value, because it is the result of new technology, and that same process causes a significant moral depreciation of existing fixed capital. Because Marx correctly calculates the rate of profit on this new morally depreciated value of fixed capital, rather than on the meaningless historic money prices paid for that fixed capital, he argues that this consequence of moral depreciation, in itself causes the rate of profit to rise, because a given mass of social surplus value, is now able to reproduce a larger mass of this fixed capital.
In addition, the circulating constant capital is also reduced in value, because these new technologies, and rises in productivity cause the labour-time required for the production of materials to fall. It was this combination of lower wages, as a relative surplus population was created in the early-mid 1980’s, a higher rate of surplus value, as the introduction of new technology reduced the value of labour-power, and of a much lower value of constant capital, as existing fixed capital was morally depreciated, new fixed capital had a much lower value, because of the advances in productivity and technology, and circulating constant capital was reduced in value because technology enabled it to be produced more efficiently, and also to be used more efficiently – global gdp rose seven times as much as the growth in oil consumption during the period from the 1980’s, until the early part of this century, for example – that led to the sharp rise in the global rate of profit after 1987.
In fact, where you argue here that the rate of profit peaked in 1997, (which seems to contradict what you have written elsewhere, about profits declining from 2007) and will trough in 2018, I believe that profits have started to be squeezed since 2012, for the same reasons Marx describes in Capital III, Chapter 6, and in Capital III, Chapter 15, as a consequence of a long wave boom, and a shift to extensive as opposed to intensive accumulation.
Its also necessary to understand Marx’s point about the distinction between the mass of profit, and the profit of enterprise. Financial analysts are continually bleating about stock markets being cheap because earnings per share are high, and so justify current valuations. Besides the fact, as you have noted, that these earnings per share figures are rigged, because of share buybacks and other engineering, the point is, as marx sets out in his analysis of the breakdown of this mass of profit, how much is taken as rent by landowners, and how much is taken as interest by share and bondholders, or banks, and so how much is left over for profit of enterprise to cover the wages of the professional managers, and to be used for accumulation.
As Andy Haldane has pointed, we have historically high levels of earnings being paid out as interest to shareholders. He argues that where in the 1970’s, only 10% of profits were paid out to shareholders as dividends, currently in the UK, the figure is more like 70%. Hilary Clinton has argued that in the US the figure is more like, 10% and 90%.
Consequently, if more earnings are used for accumulation to form capital rather than revenue, for the reasons Marx sets out flow from the objective laws of capital, then only if the figures returned to this previous level of 10% of earnings going to revenue, this would mean that share prices would fall sharply, reflecting a sharp rise in the rate of interest, as asset prices fell and yields rose.
But, it would also mean that even on the basis of current profits accumulation would rise sharply. A look at the travails of VW, indicates why large amounts of productive investment may be required, for the reasons Marx indicates of the need for capitals to compete. In other words, it creates the conditions for profits to be squeezed in the period ahead, as investment on an extensive basis rises.
Boffy Boffy Boffy you’re bullshitting again. Karl Marx never developed a long wave theory, that came after he was dead. You can’t use Capital to buttress your contrary view of the state of real capitalism.
Michael, this is unrelated to the topic, but I am not sure whereelse to comment:
Could the Great Depression be caused by the large number of deaths among people of working class in manufacturing countries? The reason is that with less people to work in industries, less value and thus less surplus were produced. To increase profits, constant capital had to be shrunk or machines had either to be let to be paralyzed or its productivity improved. Either way, at least in the sector for making means of production, there was stagnation, which led to a catastrophic spiral.
Concerning vast sums of capital that have not been invested in production of commodities, as a consequence of world wide overcapacity and general falling rates of profit:
For several weeks, the Wall Street Journal has been carefully publishing warnings of a possible bond bubble crisis brought on by the collapse in major sections of the market for corporate bonds, and bonds of nations that relied on exports to China, and consequently those entities, including banks, stuffed full of those bonds. It would appear from the content that the risk is not distant.
As Galbraith once wrote of the 1929 stock bubble: “The end had come, but it was not yet in sight.”
There is a possibility that the collapse of Glencore may bring on the crisis:
“Glencore Shares Plunge as Debt Fears Rattle Investors”
”Problems at Glencore could quickly infect other parts of the financial system and trading market. “The company has credit with most of the world’s biggest banks. It is a major transporter of oil and food around the globe.’
http://www.wsj.com/articles/glencore-sinks-to-all-time-low-on-continued-debt-fears-1443435063
“Debt-Market Tumult Hits Corporate-Bond Sales”
http://www.wsj.com/articles/debt-market-tumult-hits-corporate-bond-sales-1443480855
MORE:
http://www.wsj.com/articles/u-s-bonds-flash-warning-sign-1443382940
http://www.wsj.com/articles/investors-pull-back-from-junk-bonds-1443410976
“But as I have explained on many occasions in this blog, the credit boom of the 2000s was a response to declining profitability of capital in the productive sectors of the US, UK and other major economies from the end of the 1990s. It staved off a major slump, only to create an even larger one in 2008-9”
No. Not exactly, and exactly not. The 2001-2003 recession was the response to declining profitability in manufacturing and industrial sectors. Credit boom accompanies a)the industrial expansion of 1993-2000 and b)the recovery in manufacturing and profitability 2003-2007 (with the slopover into 2008).
Profitability does recover after 2003, although not to the 2000 level, and it does not recover based on a credit boom, but on draconian controls on capital spending, and driving real wages down from 2000 levels. This begins to reverse in 2006 as, after all those years of capital consumption, capital investment spikes up, as do wages.
Details, comrade. The devil, and the reality, are in the details, not what we wish.
Looks like a circus rather than a “conference of the Historical Materialism”. Who are these clowns? The level of stupidity in their “thesis” is incredible!